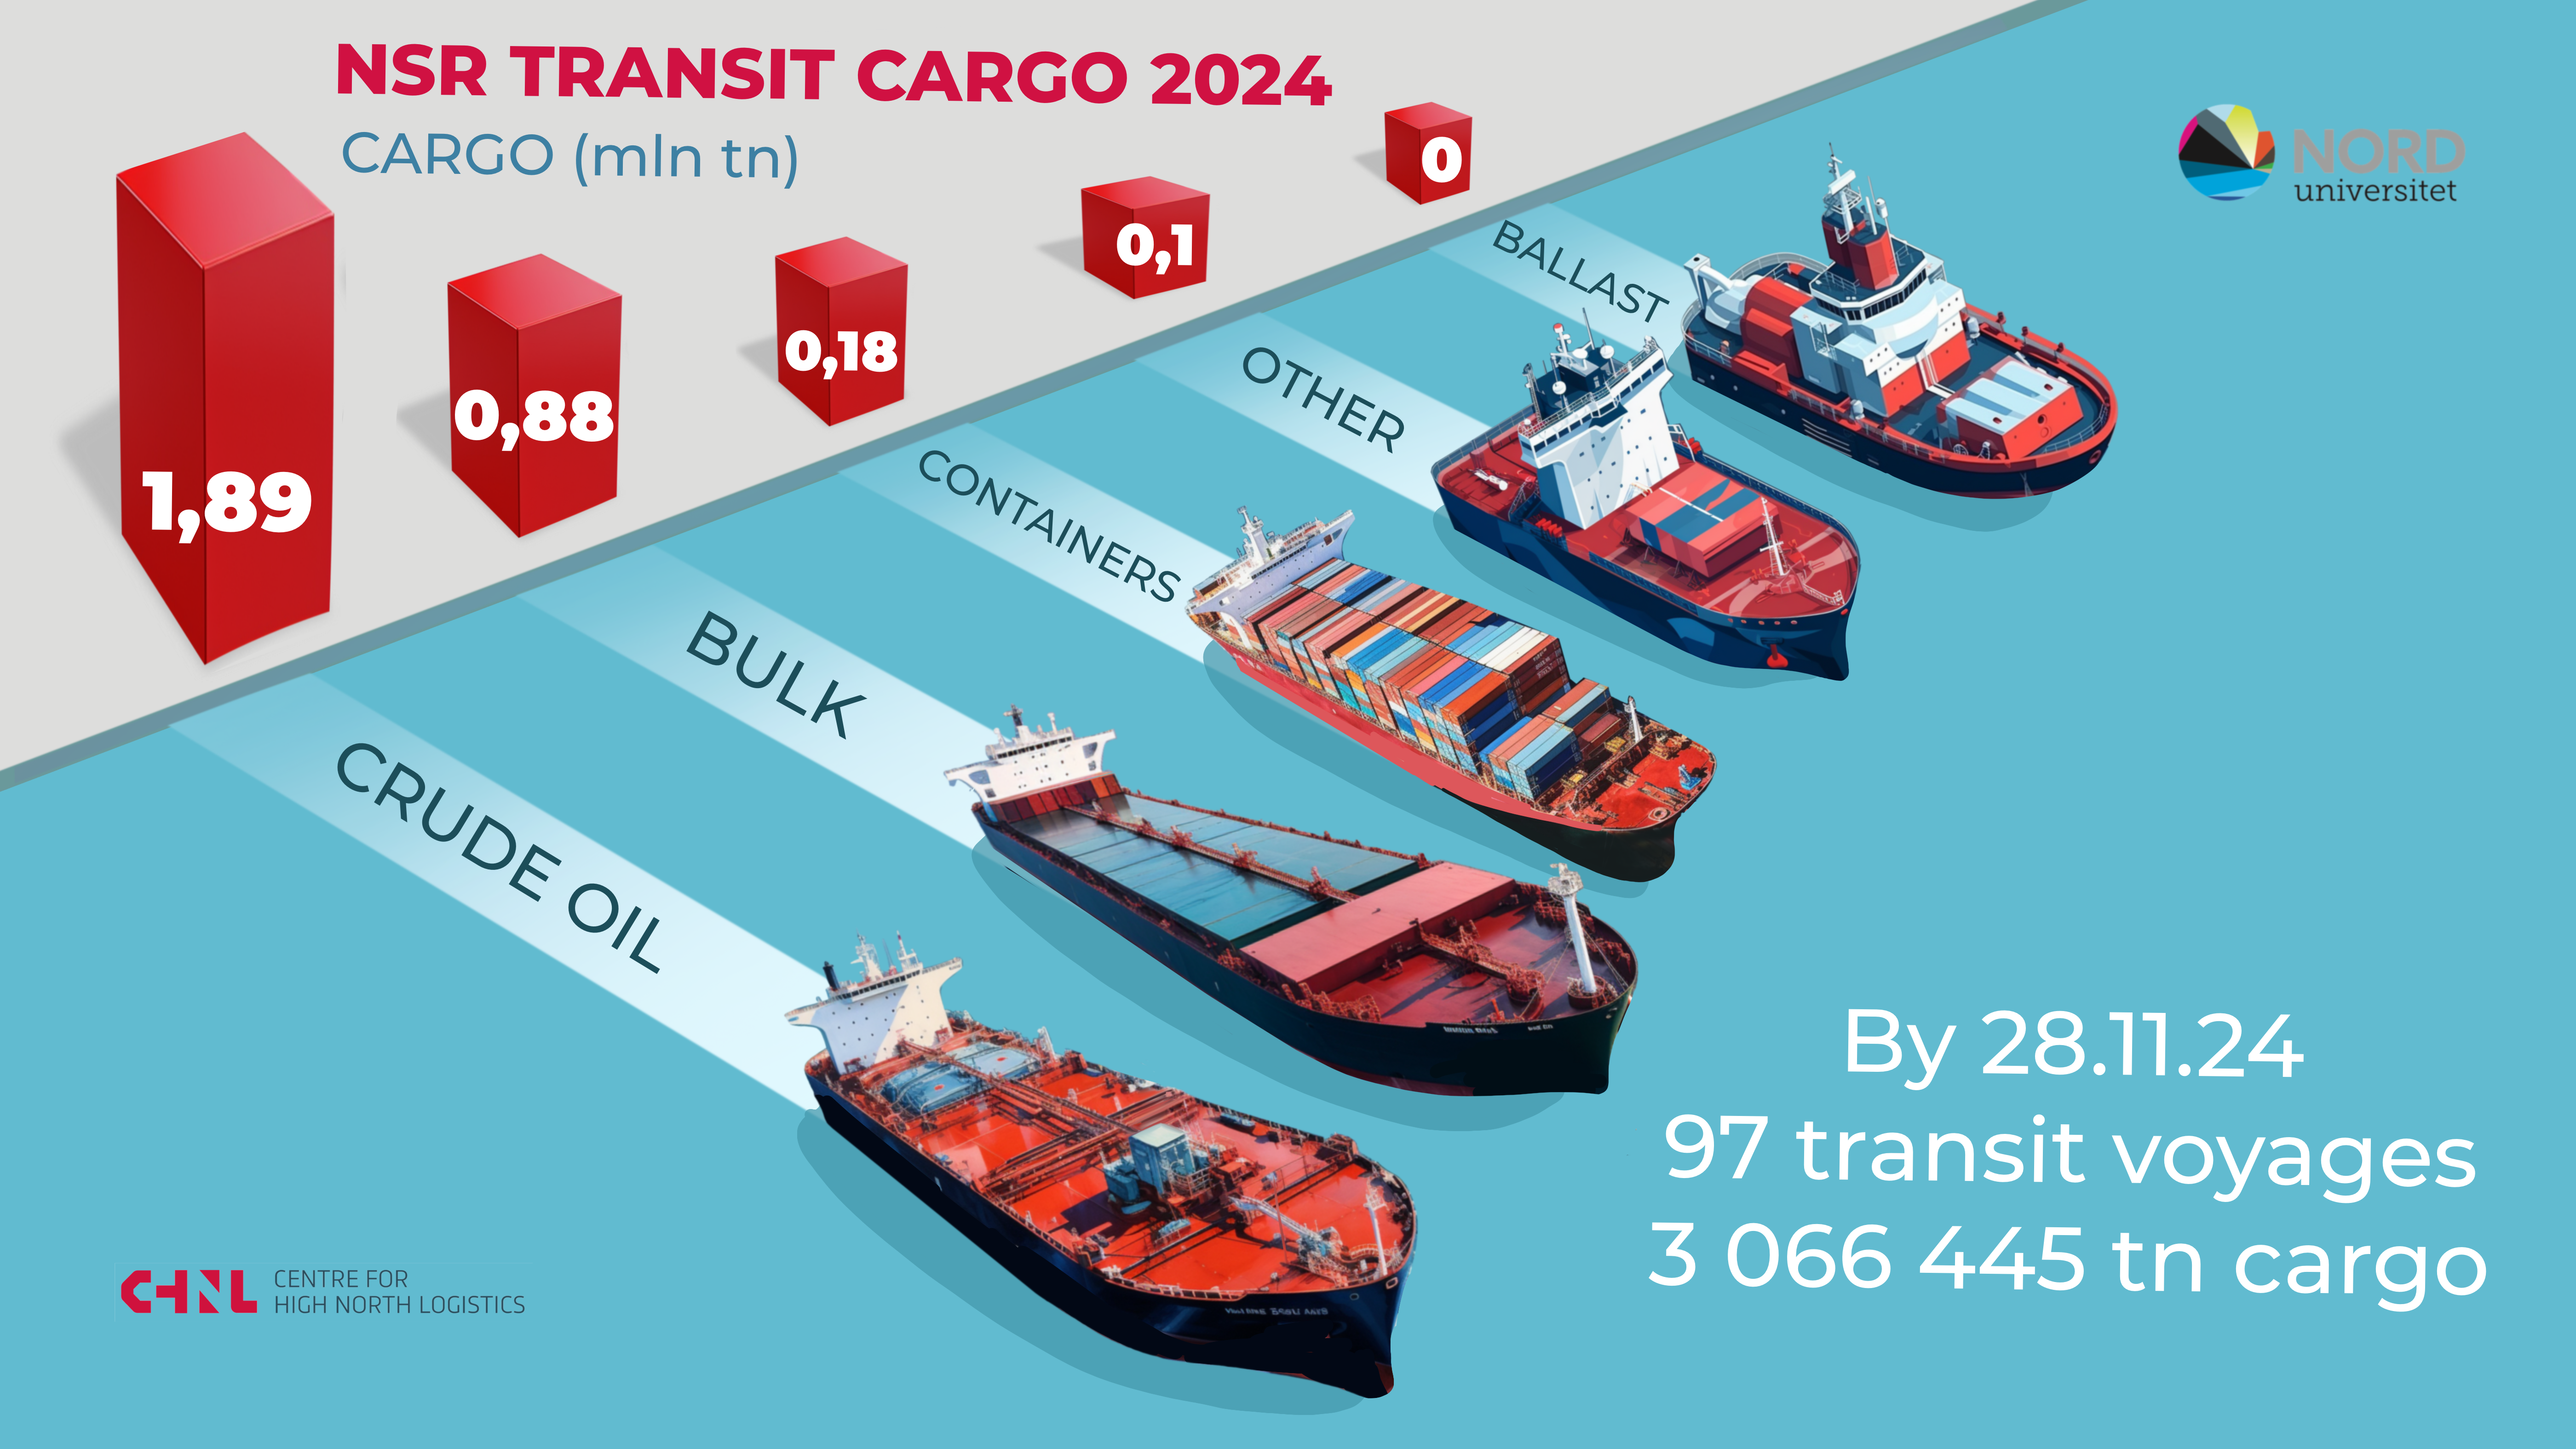
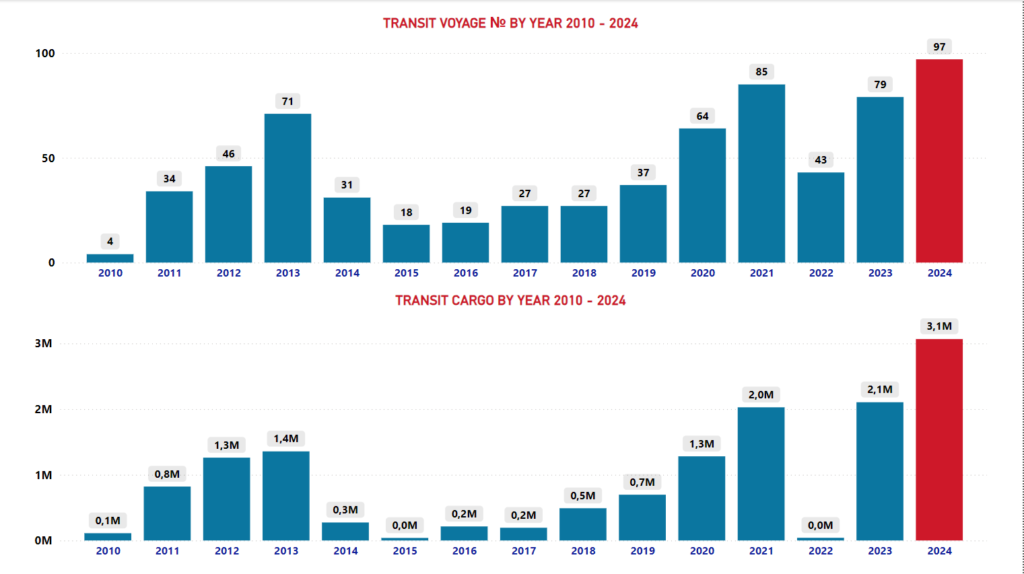
The 2024 NSR navigation season is not over yet, but the transit shipments during the summer-autumn period have already ended. This overview was compiled on November 28, 2024, and it can be said with certainty that 2024 has set a record for transit cargo through the NSR. According to our calculations, approximately 3.07 million tons were transported.
All information in this article refers to NSR transit voyages and not to all traffic at NSR. Voyage and cargo data are obtained from various sources, including Spire ShipView AIS data, vessel characteristics from the Clarkson Fleet Database, our calculations, and other reports on this topic. Therefore, all data are our estimates. Official information on the amount of transit cargo for 2024 may be presented later by the NSR General Administration. In mid-November, the representative of Rosatom reported a figure of 3.08 million tons of transit cargo.
The number of transit voyages also set a record. We registered a total of 97 voyages, 56 with cargo and 41 in ballast. Below is a graph showing the dynamics of transit voyages and cargo over the past 15 years.
Graph 1. Transit voyages through the NSR in 2010 – 2024.
Directions of Transit Shipments
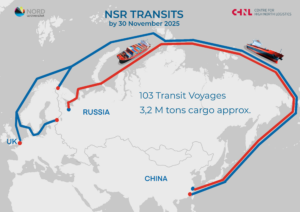
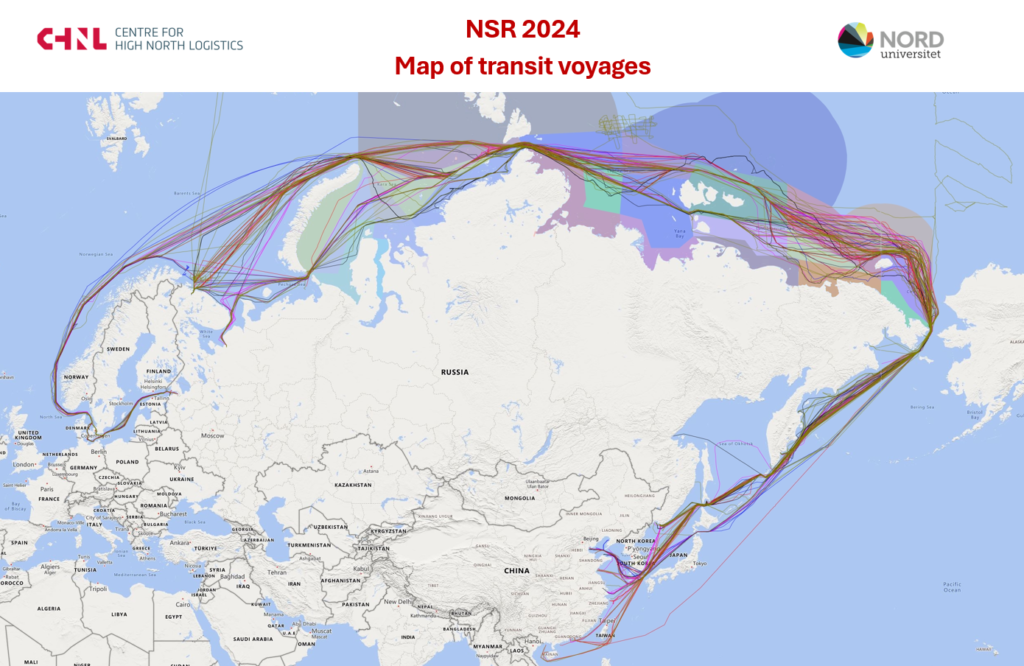
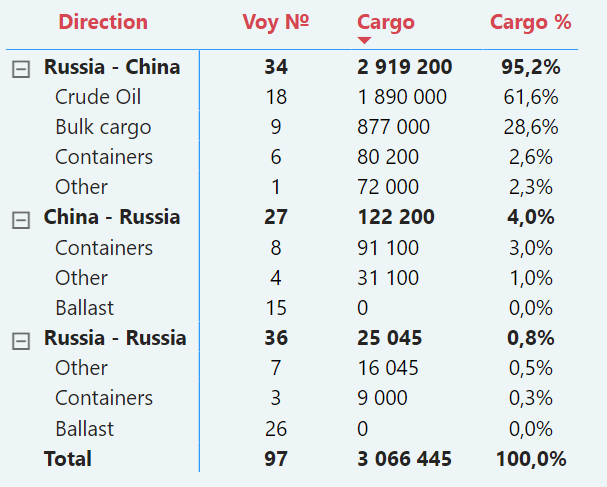
In 2024, 3 main directions of transit voyages can be identified: voyages from Russia to China, voyages from China to Russia, and voyages between western and eastern Russian ports. As in 2023, there are no international transit voyages. The distribution of voyages is as follows: Between Russian ports – 36 voyages (including voyages from west to east and from east to west), from Russia to China – 34 voyages, and from China to Russia – 27 voyages.
Map 1. Transit voyages through the NSR in 2024.
In terms of the amount of cargo transported, the direction from Russia to China overwhelmingly leads with 2.9 million tons or 95% of all transported cargo. In the opposite direction, from China to Russia, approximately 0.12 million tons were transported, which is about 4%. The amount of cargo between Russian ports was 0.025 million tons or less than 1% of all cargo. The data are presented in table 1.
Table 1. Number of voyages and amount of cargo by directions
Types of Transported Cargo
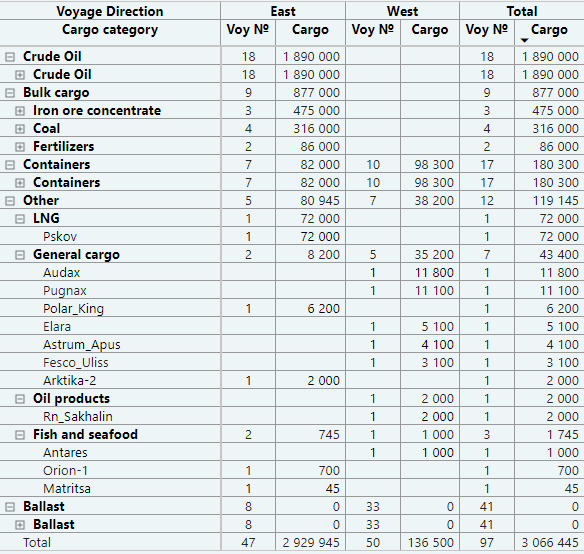
As seen in Table 1, the main types of transported cargo were crude oil, bulk cargos (coal, fertilizers, iron ore concentrate), and containerized cargo. There were single voyages for the transportation of LNG and petroleum products, also several voyages with general cargos and seafood. In addition to cargo movements, we observed the repositioning of vessels from one area to another, return voyages in ballast after discharging and ballast voyages to loading terminal. A detailed table with the distribution of cargo is provided below.
Table 2 Distribution of cargo by types and voyage direction
Next, we will examine the data on the main categories of cargo in more details.
Crude Oil
Map 2. Transportation of crude oil via the NSR.
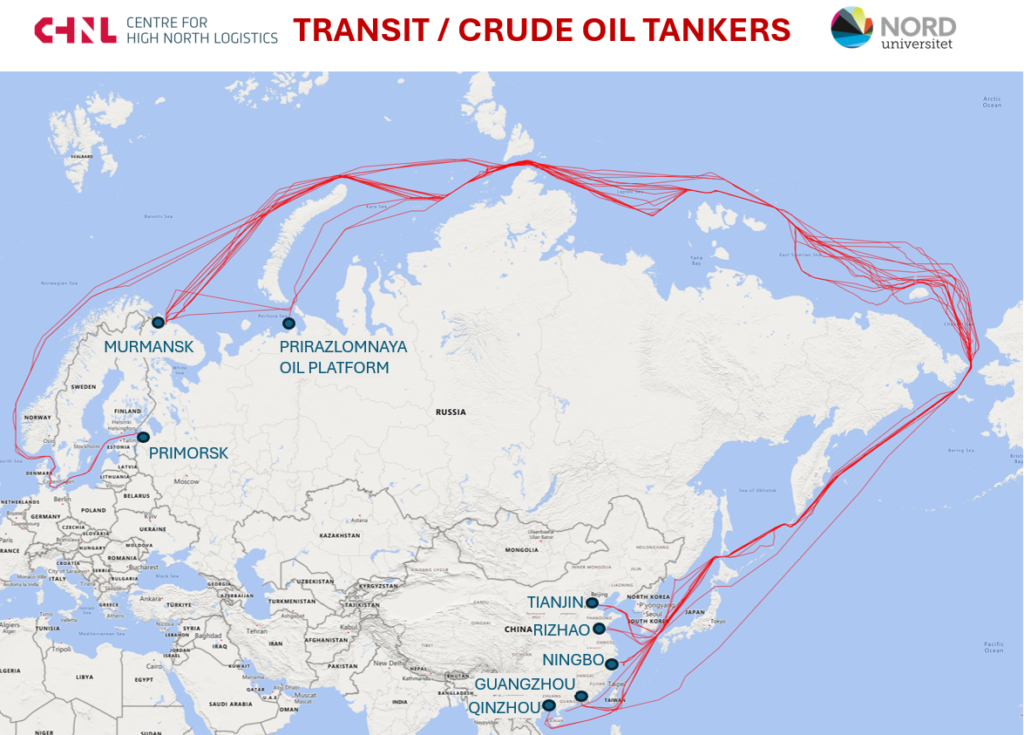
The export of crude oil from Russia to China became the main cargo of transit shipments via the NSR. A total of 18 voyages with crude oil cargo amounting to 1.89 million tons were sent. 14 tankers with a total cargo volume of 1.5 million tons departed from Murmansk. 3 voyages from Primorsk delivered 320 thousand tons of crude oil to China. There was also one voyage directly from the Prirazlomnaya oil platform. The statistics of transit shipments of crude oil do not include three more voyages from the Arctic Gate terminal.
Table 3. Transit voyages with crude oil
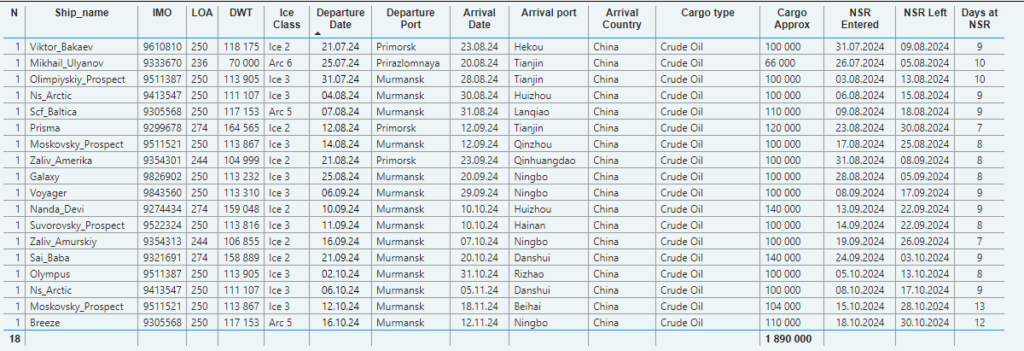
The tanker fleet involved in crude oil transportation had ice classes ranging from Ice 2 to Arc 6. Crude oil was not transported by tankers without ice class. Below is a table with tankers that, according to our data, passed the NSR without cargo.
Table 4. Transit voyages of tankers in ballast

Bulk Cargo
Bulk cargo became the second largest transit cargo on the NSR. A total of 877 thousand tons were transported. The largest amount was iron ore concentrate from Murmansk, with 3 voyages totaling 475 thousand tons transported by non-ice-class vessels. From Ust-Luga, three cargos of coal were sent, and one more coal shipment was sent from Murmansk. The total volume of coal was 316 thousand tons. From Saint Petersburg, two voyages with fertilizers totaling 86 thousand tons were sent.
Table 4. Transit voyages of bulk carriers with cargo

Map 3. Bulk cargo transportation via the NSR
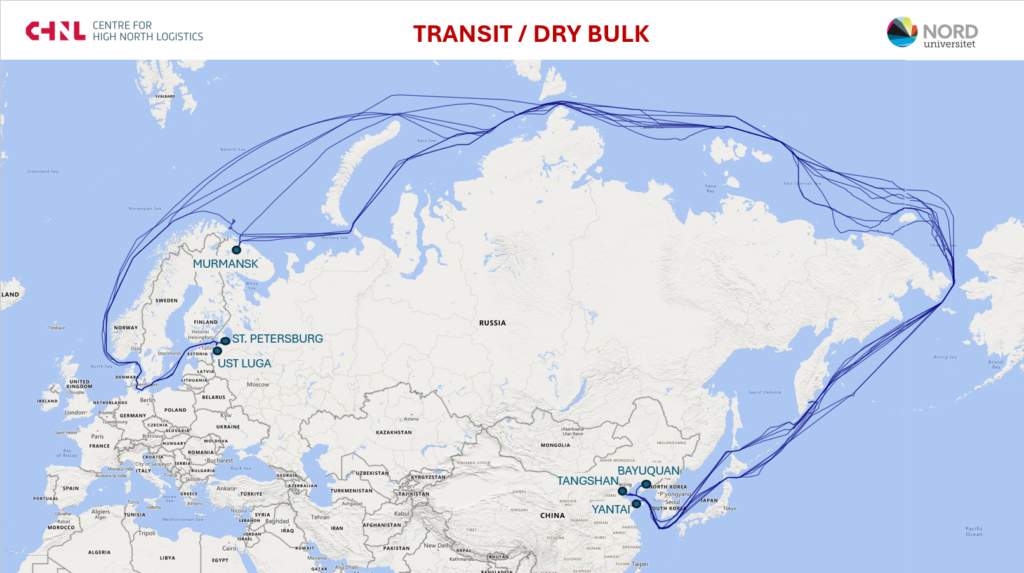
In addition to loaded bulk carriers, several bulk carriers crossed the NSR in ballast.
Table 5. Transit voyages of bulk carriers in ballast

Container Transportation
Container transportation was mainly carried out between Chinese ports and the Russian ports of Arkhangelsk and St. Petersburg. Cargoes from China included sets of auto parts, construction equipment and materials, passenger cars, clothing, footwear, and chemical products. From Arkhangelsk to China, containers with lumber, pulp, polyethylene, and cardboard were shipped.
Map 4. Container transportation via the NSR
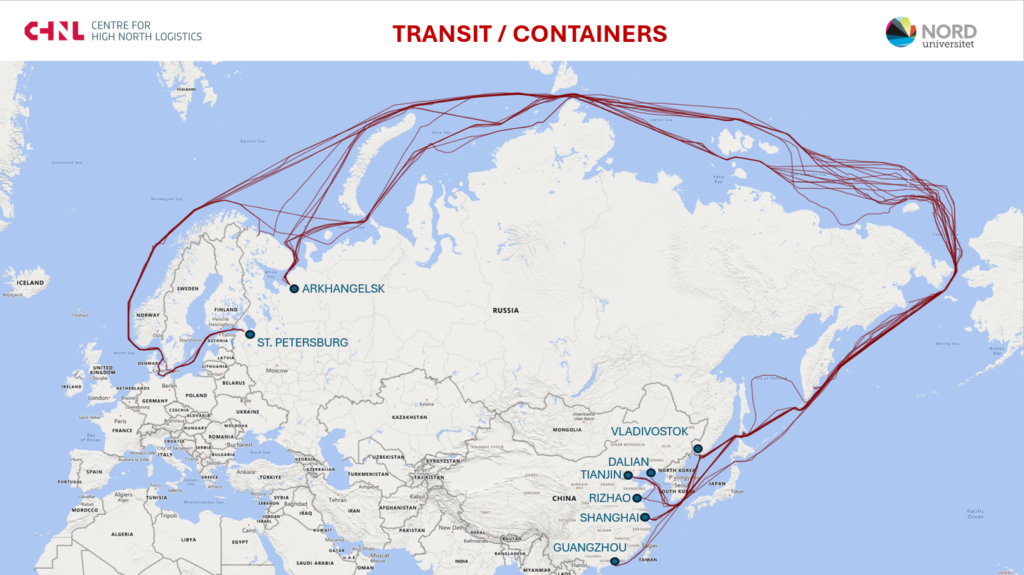
A total of 17 voyages with containerized cargo were made. Of these, 8 voyages were from China to Russia, 6 voyages from Russia to China, and 3 voyages between Russian ports.
Table 6. Container Cargo from China to Russia

Table 7. Container Cargo from Russia to China

Table 8. Container Cargo from Russia to Russia

Ice Conditions
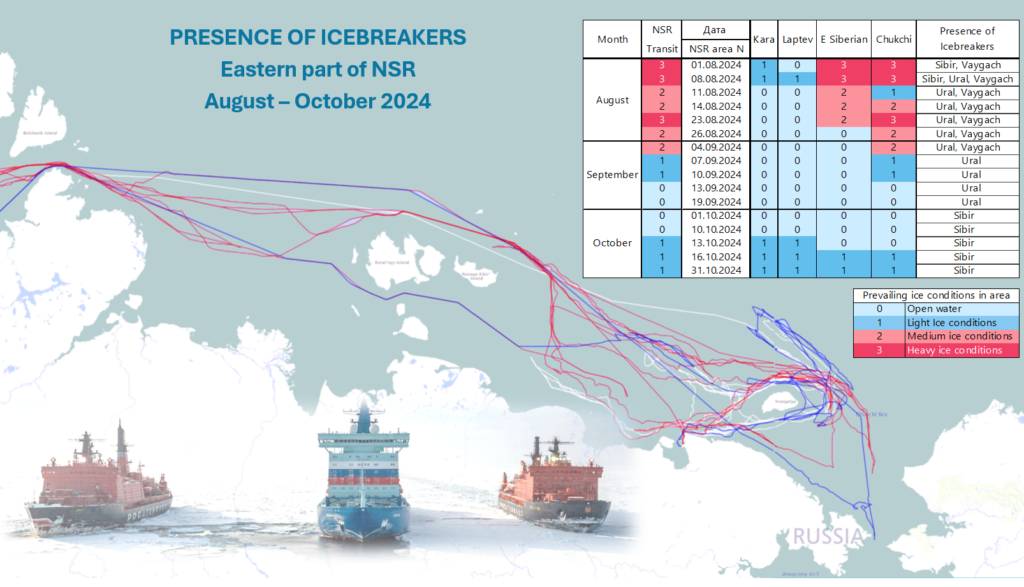
Ice conditions are one of the key factors affecting transit navigation. They determine the navigation period, vessel admission, and significantly influence the overall safety of navigation. For a brief overview of the ice situation during the active transit navigation season on the NSR, we used data on ice conditions by NSR regions for the period from August 1 to October 31, 2024, available on the NSR General Administration website. For publication purposes, we will use generalized periods and assumed ice conditions that vessels may encounter while transiting. For a rough estimate, transit navigation season in 2024 can be divided into several time periods. The first from August 1 to August 10 – during this time, heavy ice conditions persist in the East Siberian Sea. The second from August 11 to September 6 – medium ice conditions prevail in the Chukchi Sea. The third from September 7 to September 12 – light ice conditions were observed in the Chukchi Sea. The fourth from September 13 to October 12 – an open water route was maintained along the entire NSR. The fifth period from October 13 to October 31 – routes allowing passage through light ice conditions were maintained throughout the entire NSR. Below is a map with tracks and approximate icebreaker operation times in the eastern part of the NSR.
Map 5. Presence of icebreakers in the eastern part of the NSR in August – October 2024.
Conclusions on Transit Navigation
Transit shipments via the NSR in 2024 remain an additional seasonal route for exporting raw materials from Russia to China, as well as a seasonal route for delivering containerized cargo from China to Russia. Overall, we observe approximately a 45% increase in transported transit cargo volume through the NSR in 2024 compared to 2023.
