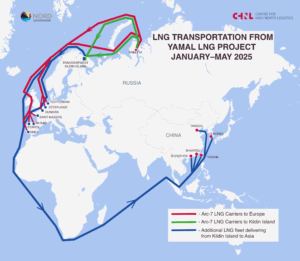
This update builds on the June 3, 2025, article reviewing LNG exports from the Yamal LNG project for January – May 2025. It covers the period from June 1 to August 31, 2025, and compares cumulative figures for the first 8 months of 2025 with the same period in 2024. As in the previous article, we count the number of voyages departing from the port of Sabetta during the specified period and separately analyze shipments after transshipment at Kildin Island.
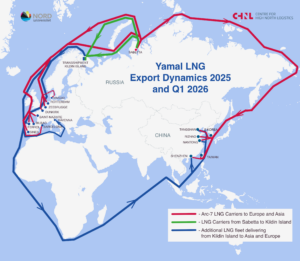
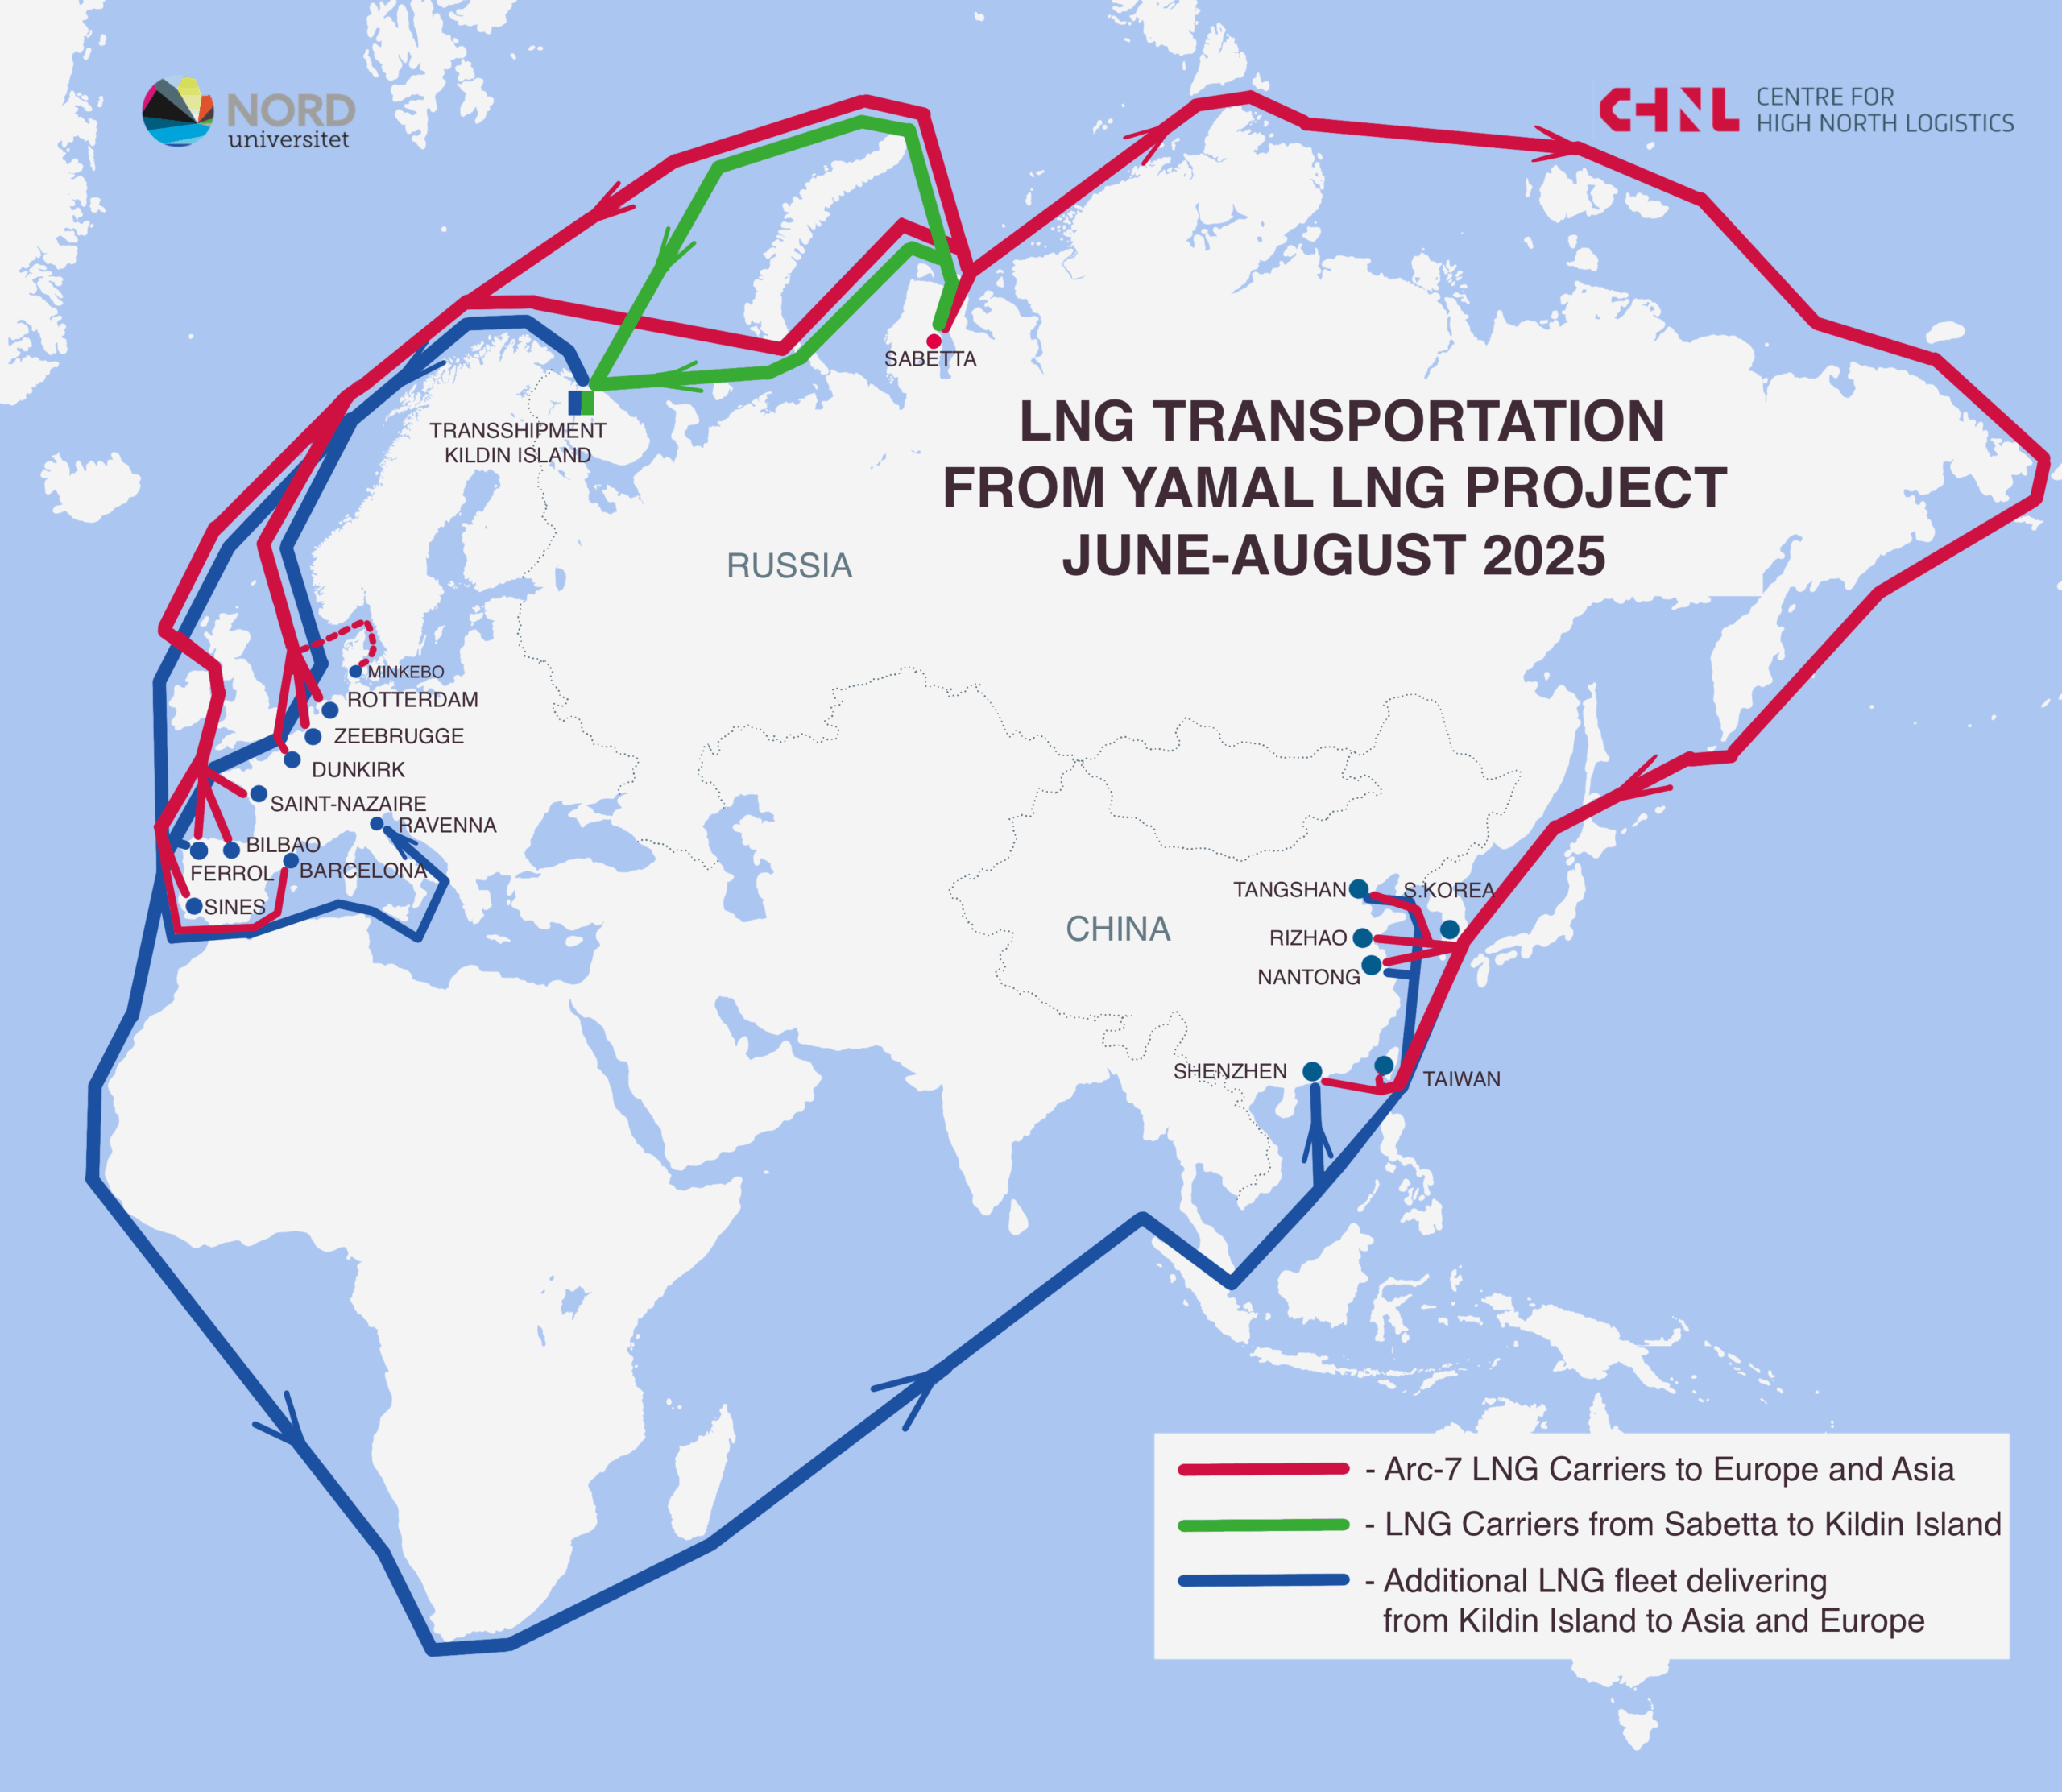
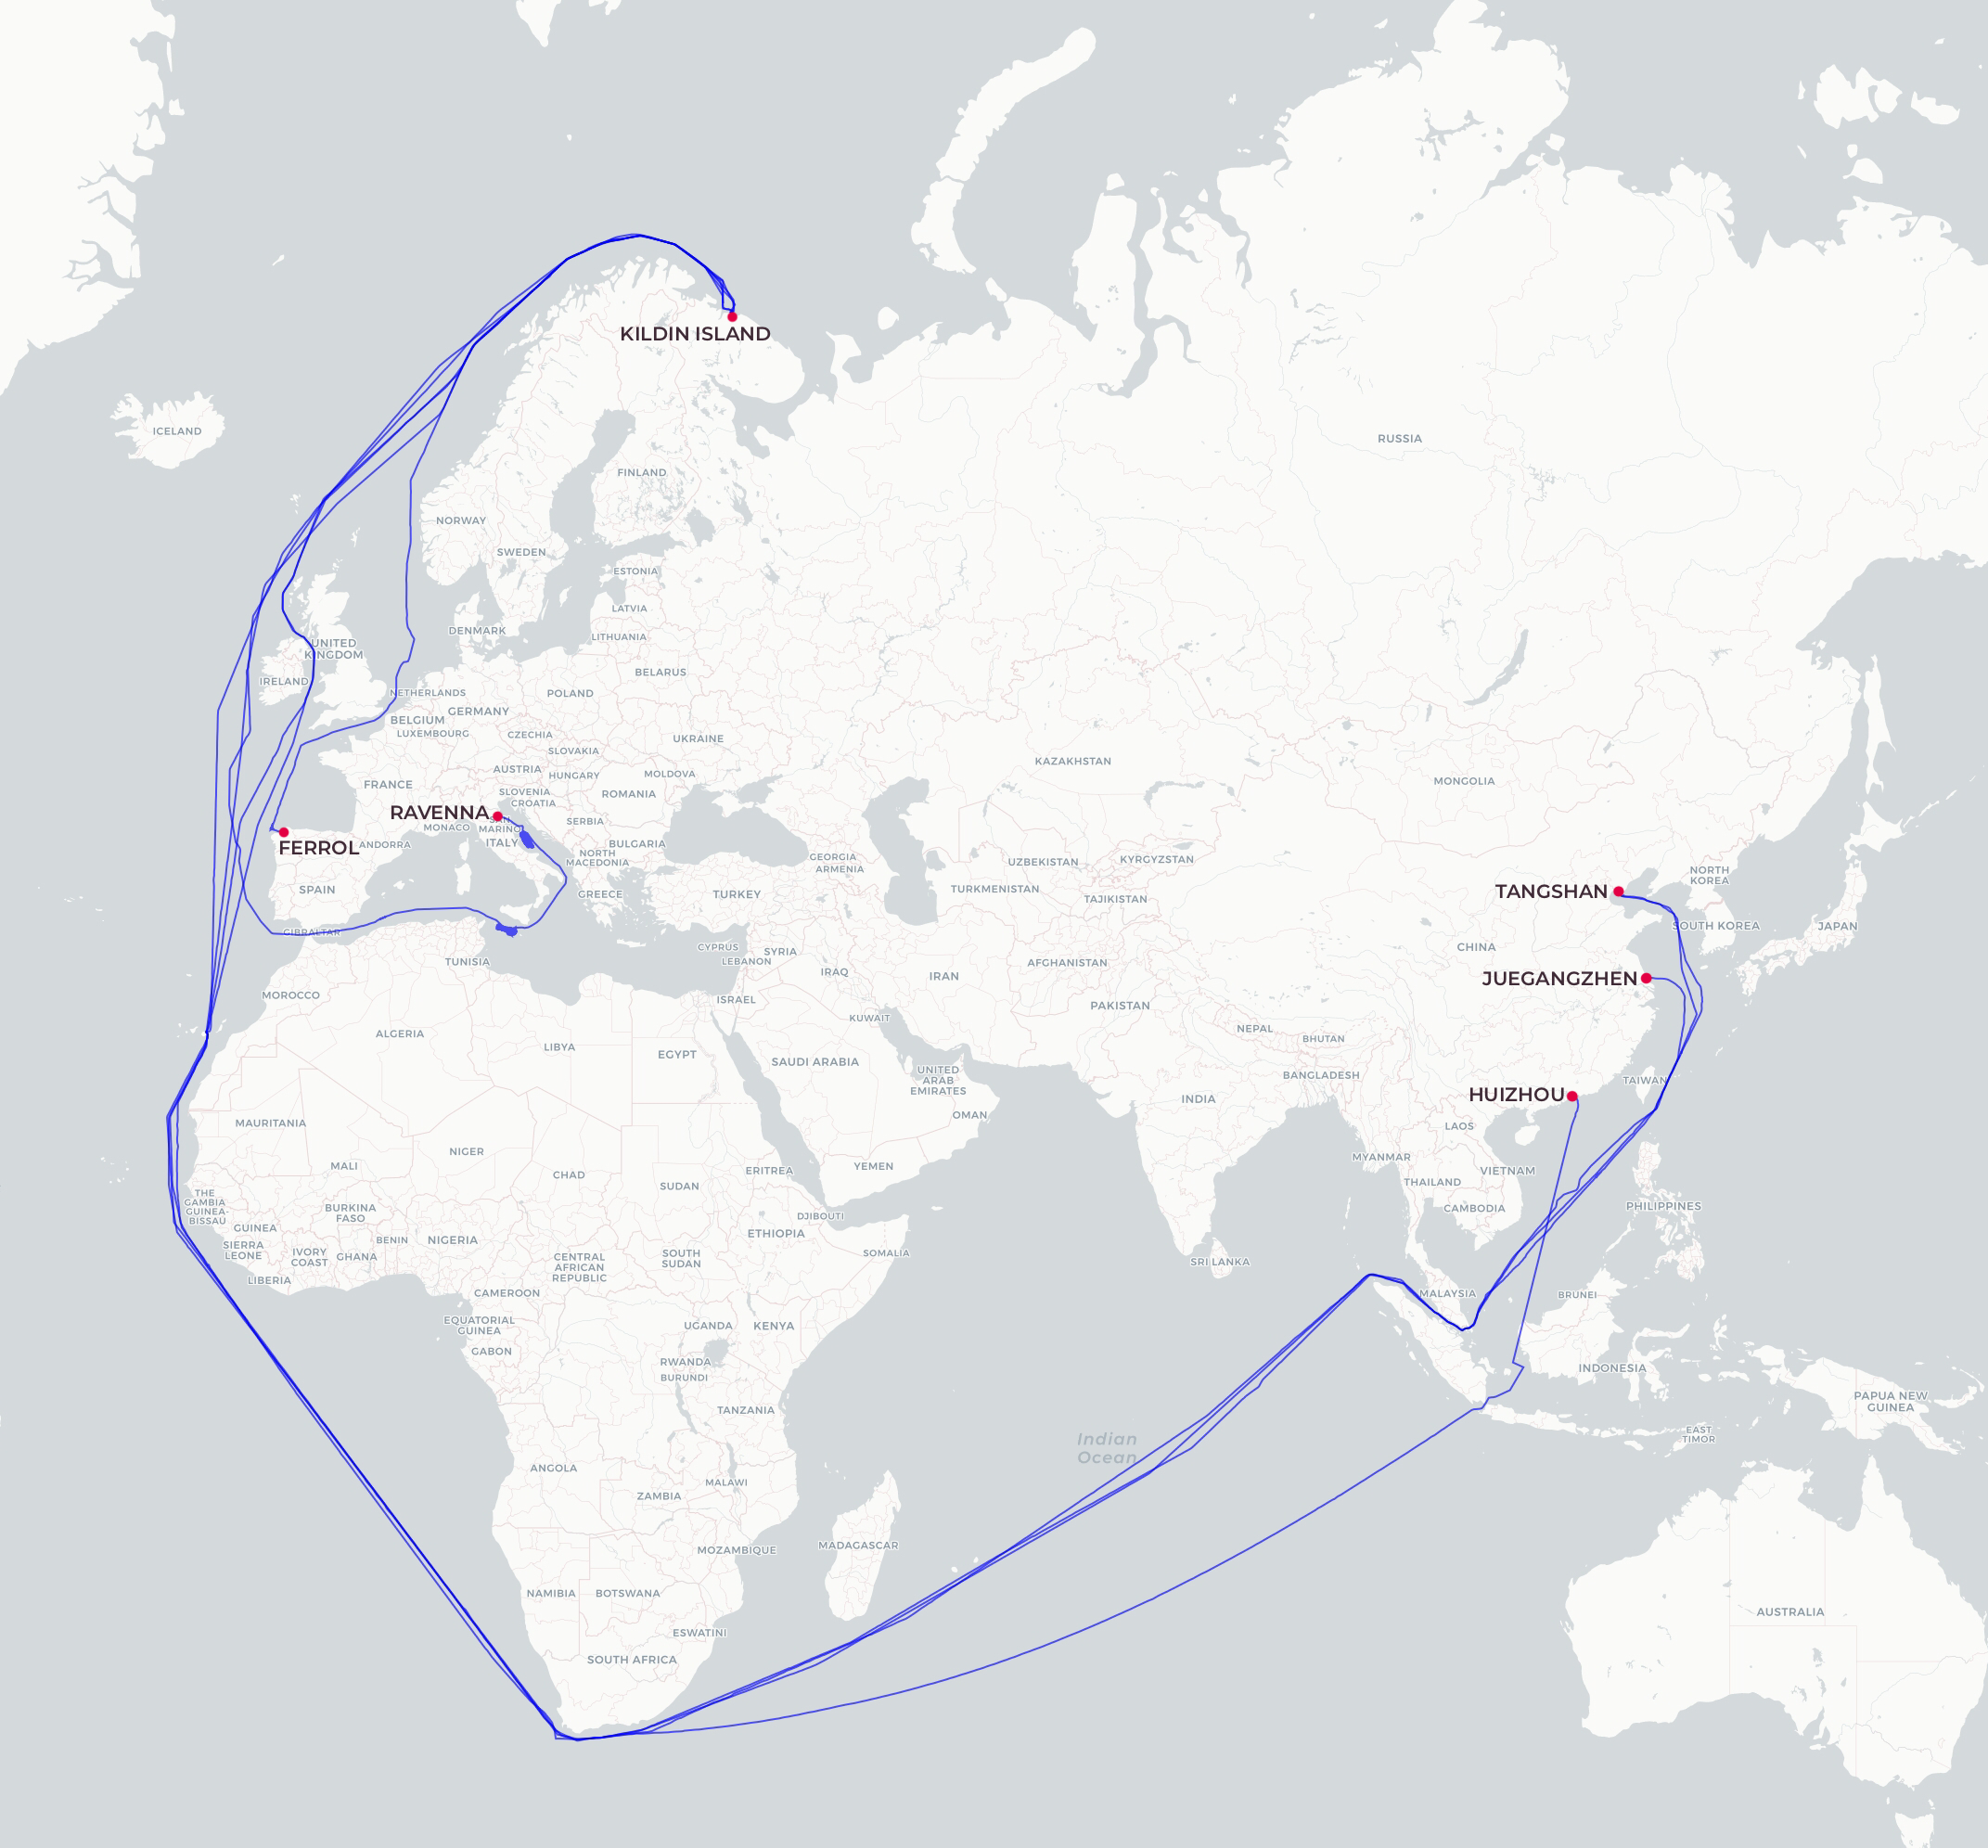
Below is the general map of LNG transportation for June–August 2025. Red lines show the tracks of Arc7 ice-class vessels, which operated both westward to Europe and eastward to Asia. Green lines represent voyages by non-ice-class vessels and Arc4 ice-class ships that were additionally deployed during the summer–autumn period. These vessels transported LNG to Europe and to Kildin Island. Blue lines highlight the tracks of ships that delivered cargoes following transshipment near Kildin Island. A separate map for these vessels is provided in the next section.
Map 1. Ship tracks of LNG Export from the Yamal LNG Project (June–August 2025)
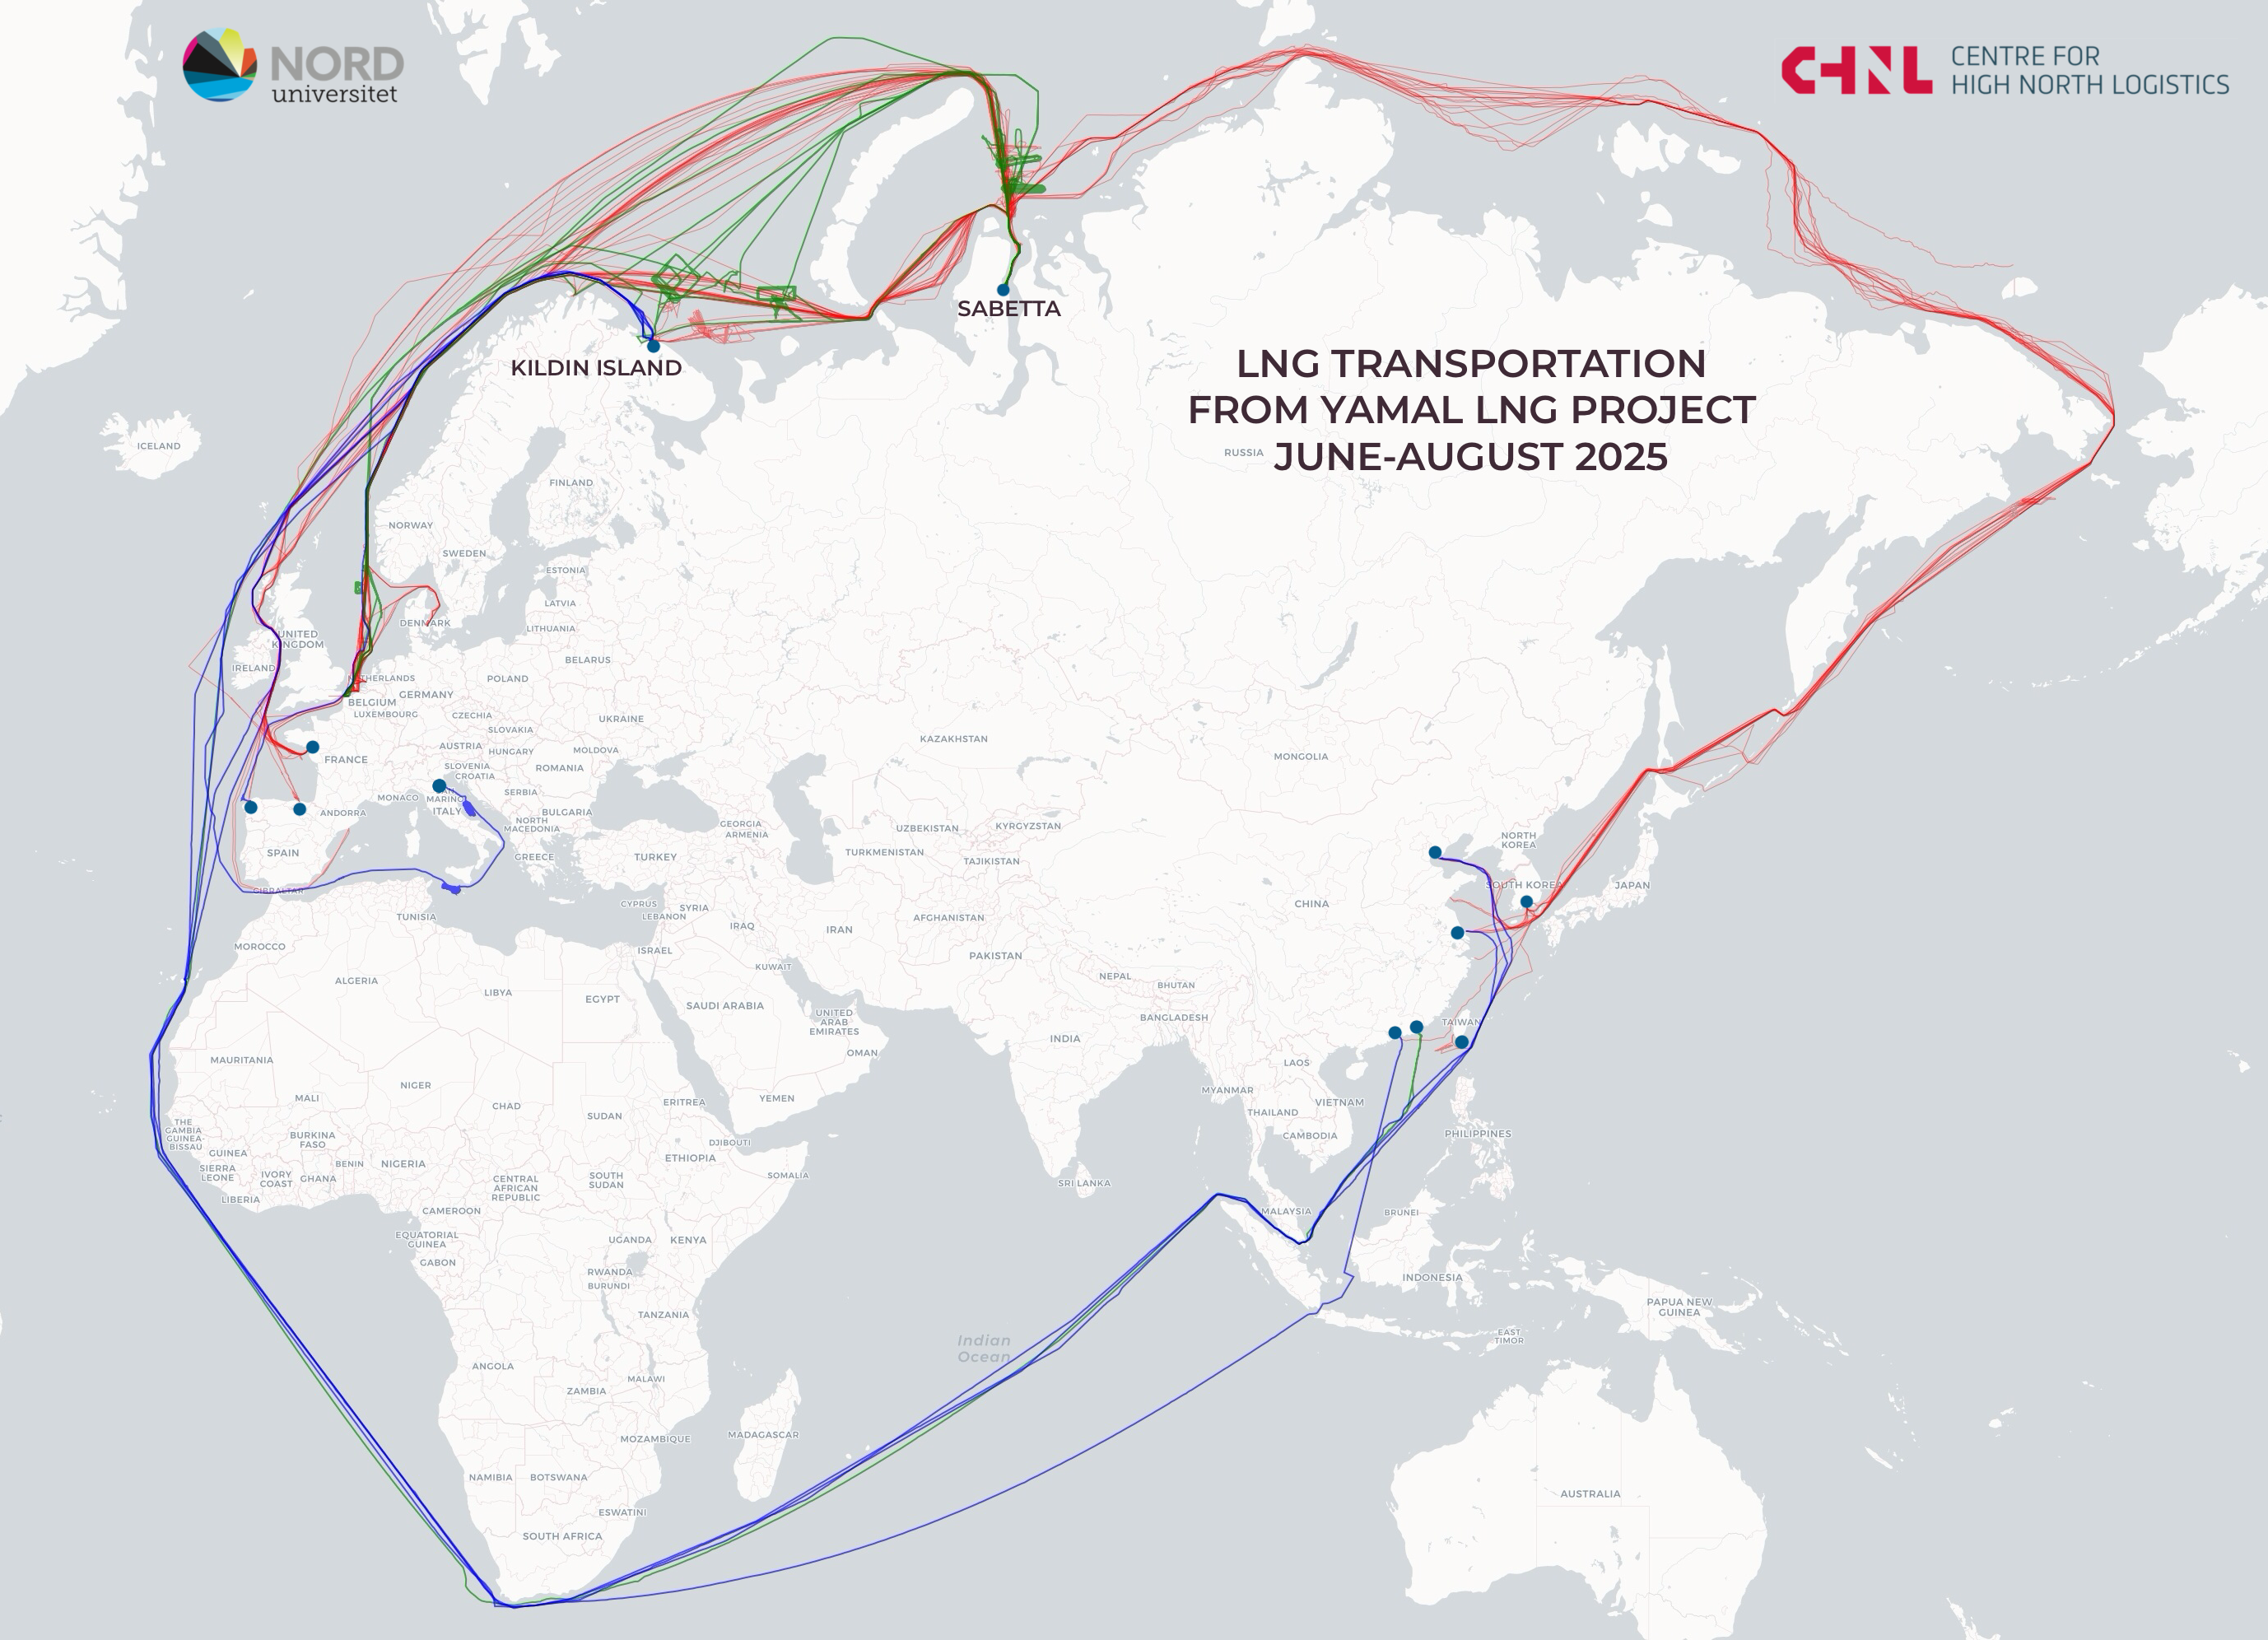
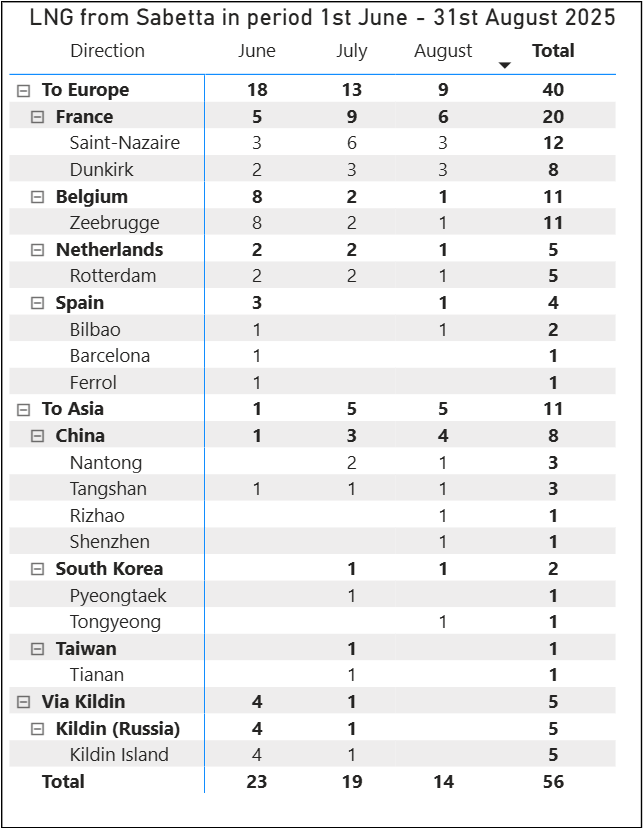
During the summer months, a total of 56 LNG cargo shipments were recorded from the Yamal LNG terminal. Of these, 5 voyages were directed to Kildin Island for transshipment, 8 shipments went to China, 2 to South Korea, and 1 to Taiwan. The remaining 40 shipments were distributed among European countries, including France, Belgium, the Netherlands, and Spain.
Figure 1. Distribution of voyages by destination and comparison of voyage counts by country in summer 2024 and 2025
Compared to the same period in summer 2024, the number of shipments decreased by 13. The most significant drop occurred in August 2025, with only 14 shipments, compared to 24 in August 2024.
Table 1. Distribution of voyages by month and destination port in June–August 2025
Shipments after transshipment at Kildin Island.
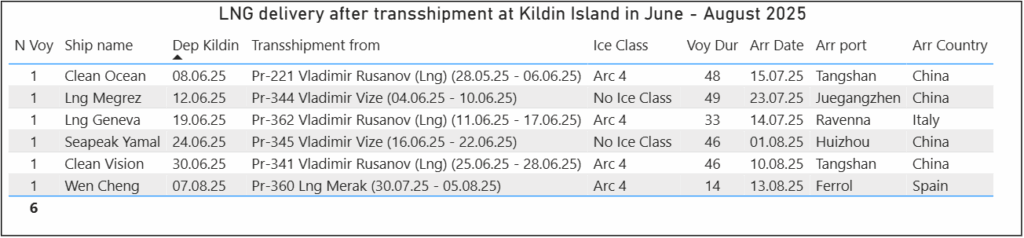
During the same period, 6 transshipments were conducted at Kildin Island. Five of these involved vessels that departed from Sabetta between June and August, while one was from a vessel that left Sabetta in late May. Following transshipment, four shipments were sent to China via the southern route, one to Spain, and one to Italy. In total, 30 LNG shipments were routed through Kildin Island during the first 8 months of 2025.
Table 2. LNG deliveries following ship-to-ship transfer near Kildin Island in June–August 2025
Map 2. LNG deliveries following ship-to-ship transfer near Kildin Island in June–August 2025
Comparison of cumulative voyage figures for the first eight months of 2024 and 2025.
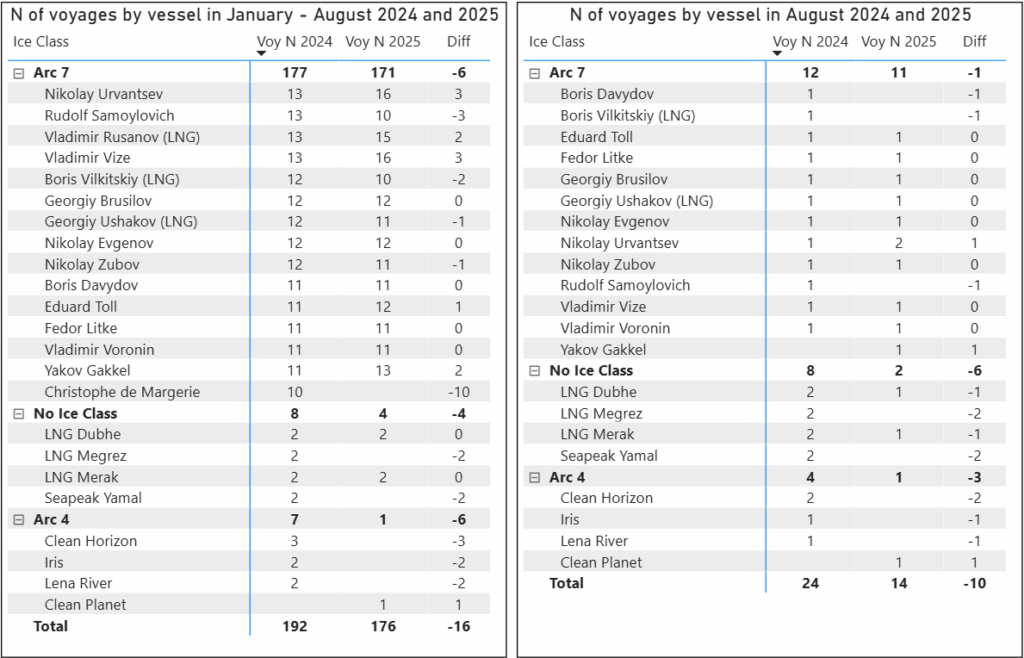
By the end of August, the total number of LNG cargoes shipped in 2025 was 16 fewer than in the same period of 2024. As noted in the previous report, by the end of May the decrease was only 3 shipments compared to the same timeframe in 2024. This decline may correspond to a reduction of approximately 1.2 million tons of LNG, with a significant portion – 10 shipments or roughly 740,000 tons – falling in August alone.
Table 3. Comparison of voyage counts for each vessel in 2024 and 2025
At this stage, it is difficult to determine the exact cause of the 42% drop in shipments in August 2025 compared to August 2024. Whether this decline is temporary or indicative of a longer-term trend will become clearer by the end of the year. For now, a brief analysis of vessel movements in August 2025 allows for some preliminary assumptions.
Ice-class Arc 4 vessels and non-ice-class vessels saw a reduction of 9 voyages. Of the 7 vessels involved in August 2024 shipments, only 2 were active in August 2025. Arc-7 ice class vessels completed only one voyage fewer, even though some of them made a stop at the port of Munkebo (Denmark), likely for technical maintenance.
Statistical picture of vessel participation indicates that the reduction in voyages in August 2025 was concentrated among non-ice-class vessels and Arc 4 ice-class vessels, which are traditionally used on a seasonal basis. This trend reflects a shift in fleet utilization patterns, but it does not indicate a shortage of available vessels.
An additional factor considered was the time vessels spent waiting before entering Sabetta for loading. In August 2025, vessels spent approximately 64 days waiting at sea or anchored near Sabetta, which may indicate delays in cargo availability.
Table 4. Estimated number of days vessels spent at sea or anchored near the port of Sabetta while waiting.
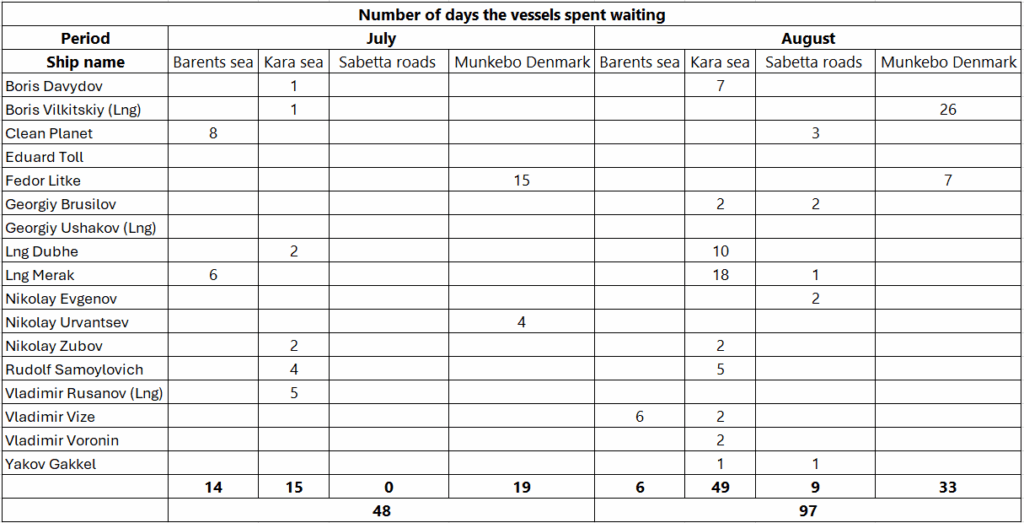
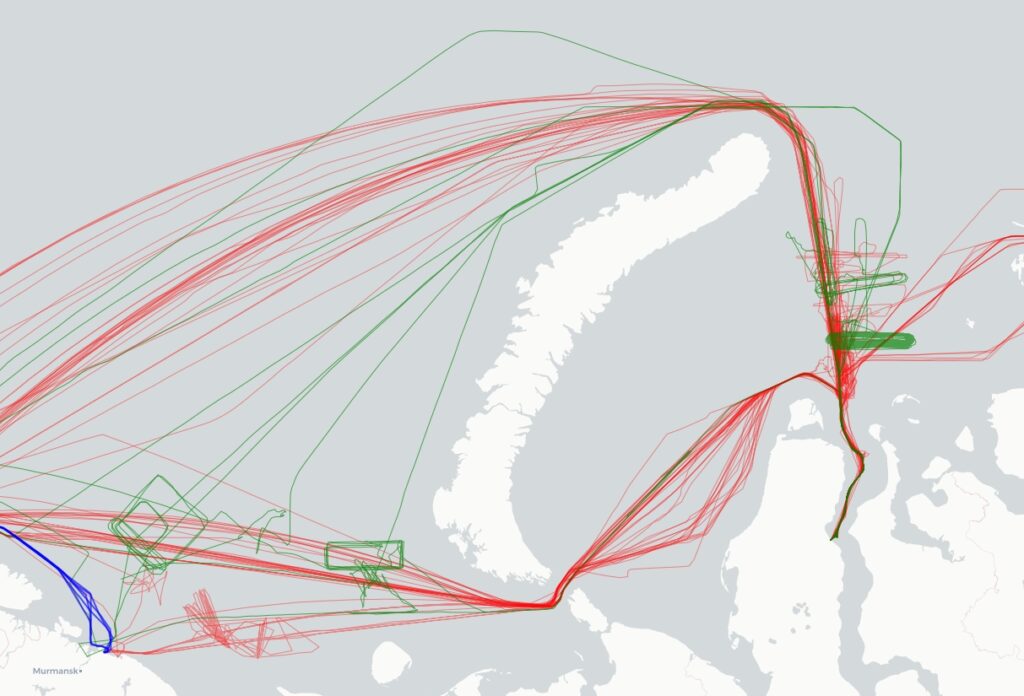
These waiting periods are also visible in vessel tracks at the Kara sea.
Map 3. Fragment of the LNG vessel movement map in the Barents and Kara Seas
This suggests that the decline in shipments observed in August is more likely due to a drop in LNG production rather than a lack of available fleet capacity. For reference, in August 2021, there were also only 14 shipments. At that time, media reports indicated that the first production line was shut down for 19 days for scheduled maintenance. In August 2023, there were 18 shipments.
The next update is scheduled for release in mid-January 2026 and will provide a full-year overview.