Introduction
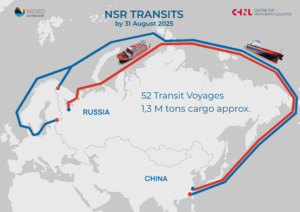
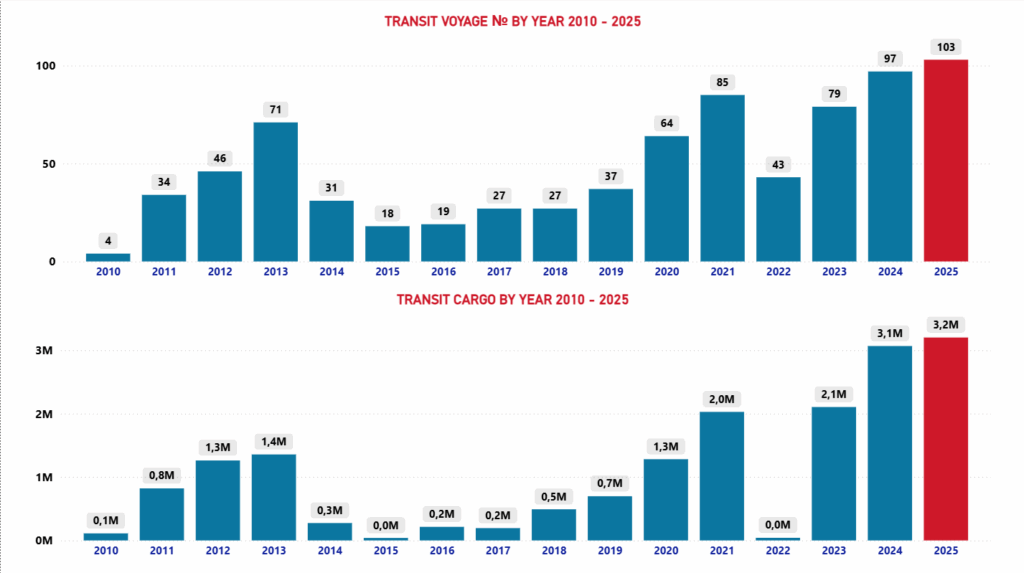
The summer–autumn transit navigation season on the NSR in 2025 has now concluded. The first transit vessel entered the route on June 30, and the last one exited on November 17, making the navigation period approximately four and a half months long. By November 30, 2025, we recorded 103 transit voyages performed by 88 unique vessels, some of which completed two voyages. This number includes all voyages that crossed both boundaries of the Northern Sea Route and did not make port calls within NSR waters. Of these, 52 voyages were eastbound and 51 westbound.
According to Rosatom’s statement made in November 2025, the total volume of transit cargo on the NSR reached 3.2 million tons. While we do not have precise figures for the cargo, our internal estimates are closely aligned with this number. In the detailed tables, we indicate the possible cargo type and approximate quantities. These figures are not official cargo data and should be considered as assumptions for indicative evaluation. Official statistics on the number of voyages and cargo volumes are usually published by Rosatom after the season ends.
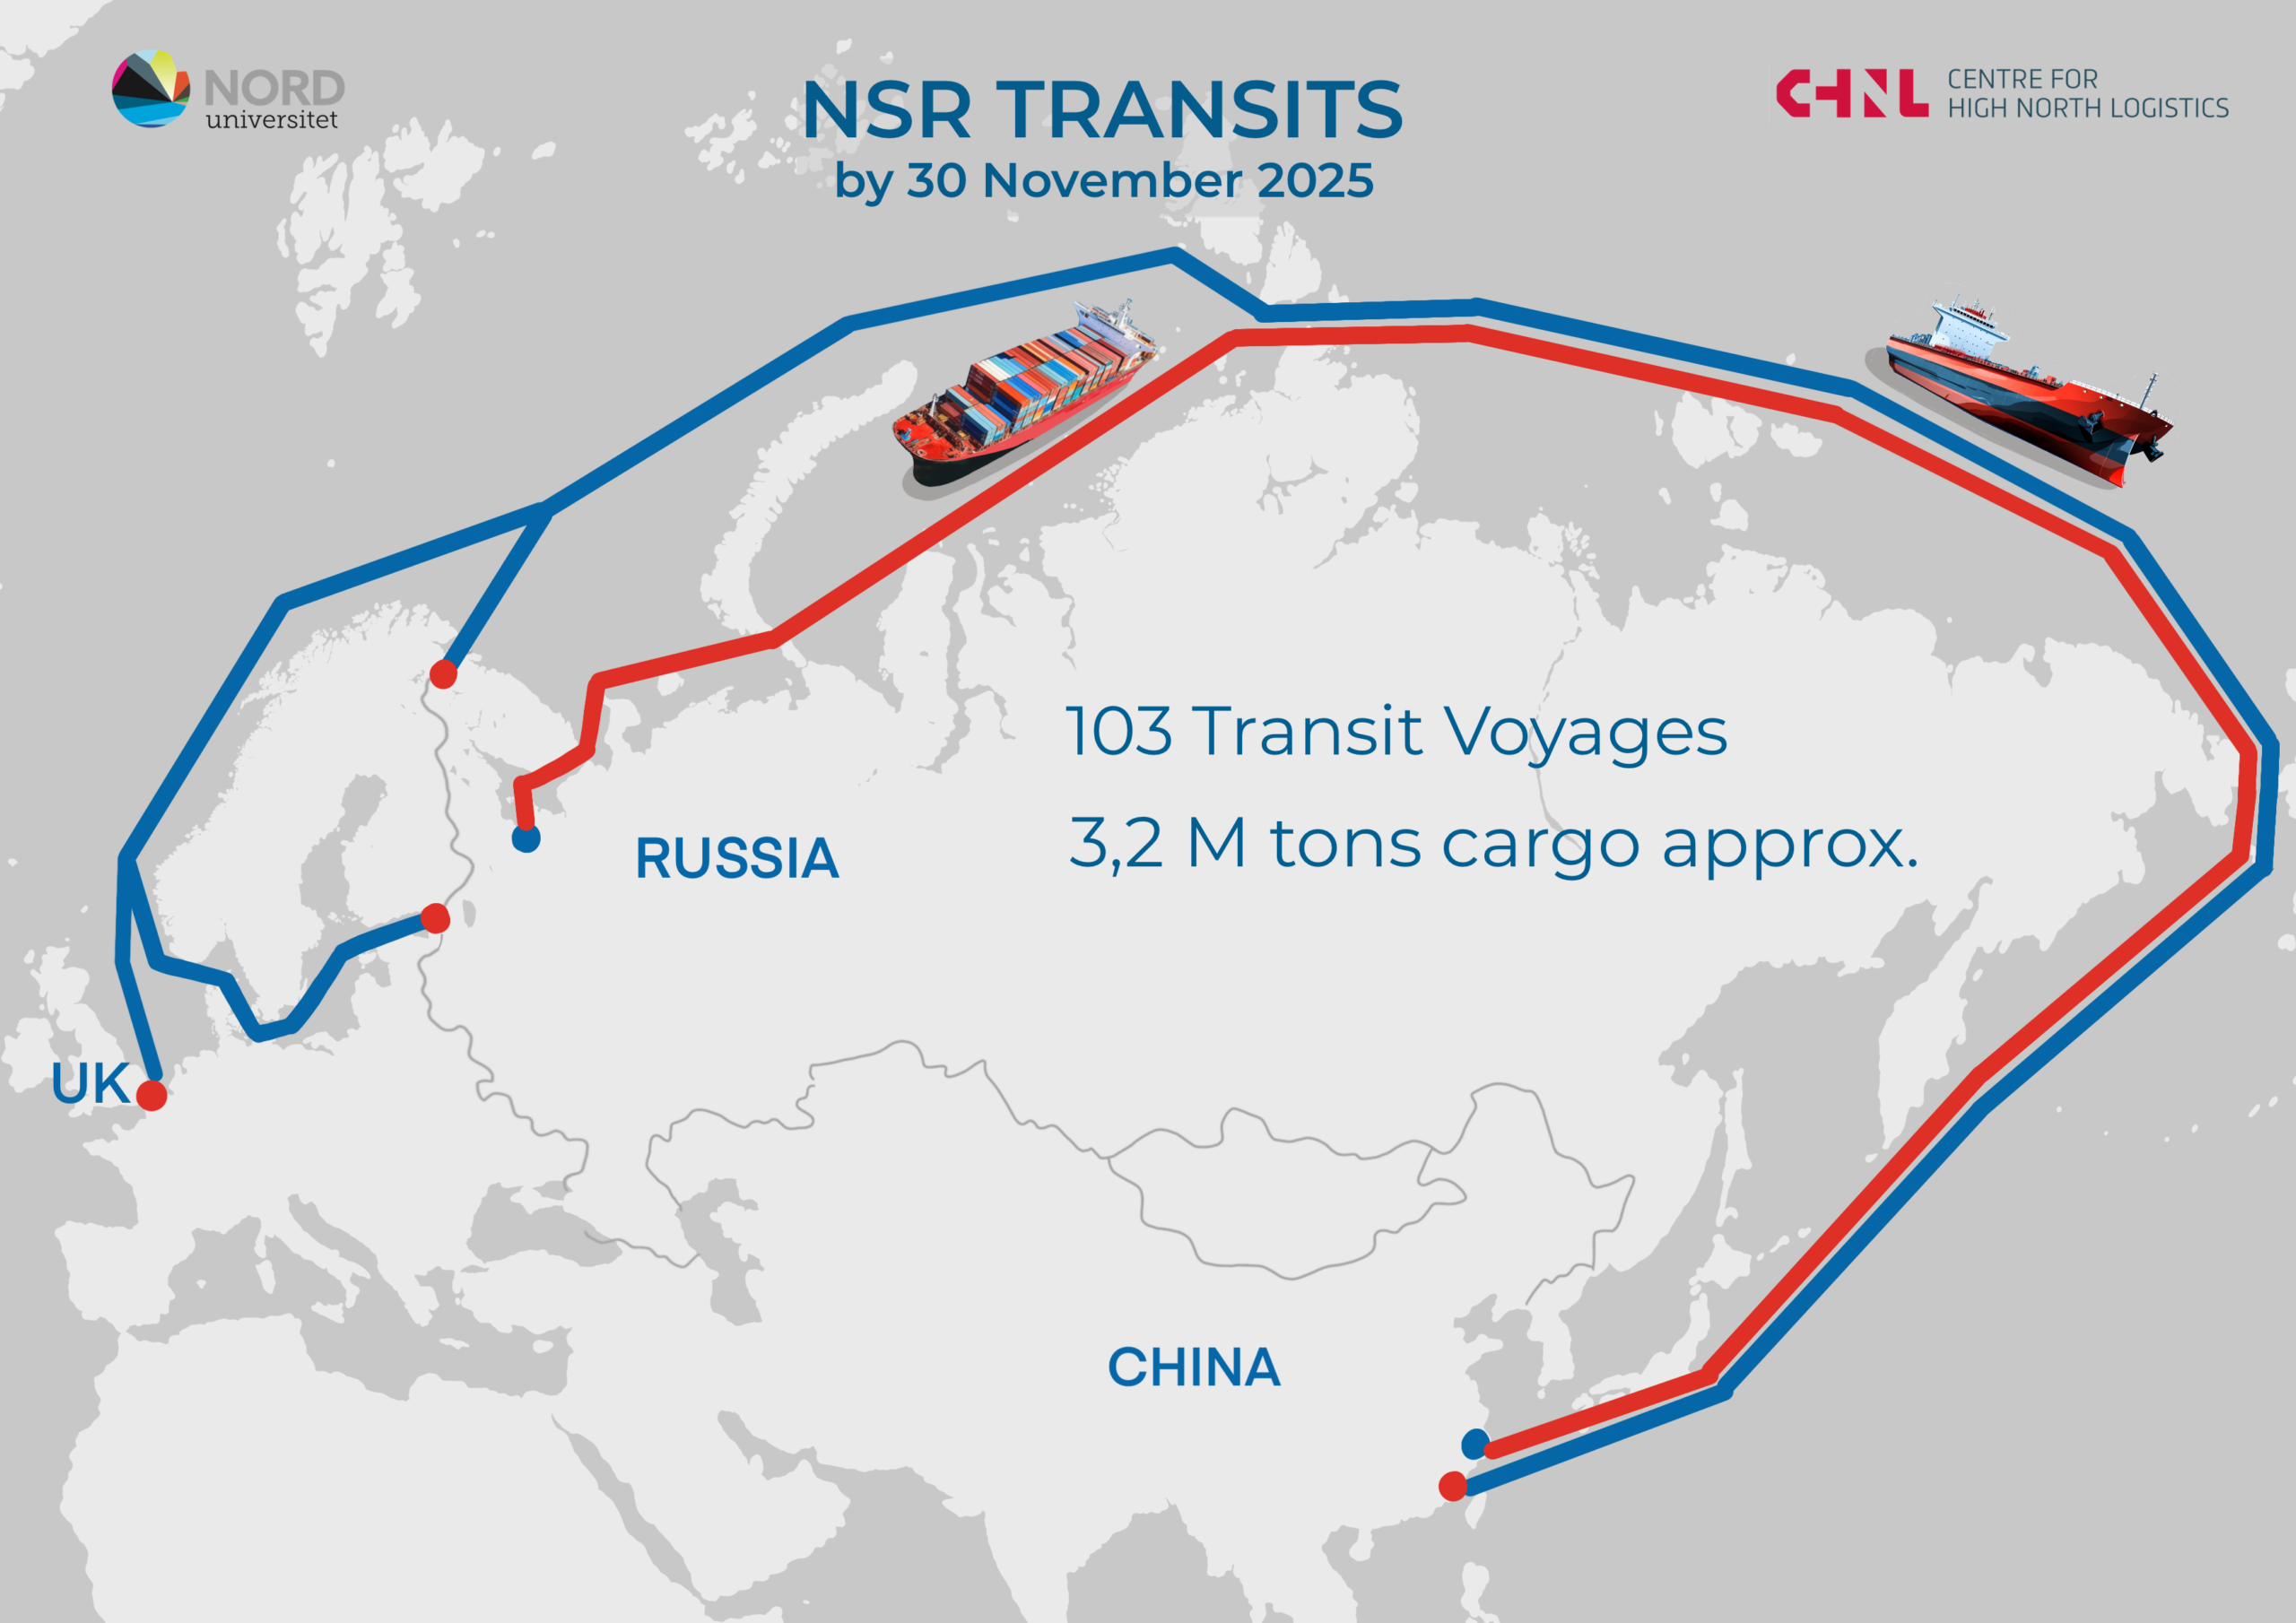
Figure 1. Number of westbound and eastbound transit voyages by vessel type on the NSR.
The main share of transit cargo traffic consisted of tanker shipments, as in 2024. Tankers completed 34 passages: 23 eastbound and 11 westbound. The second largest group was bulk carriers with 23 voyages, 16 of which were westbound (likely in ballast for repositioning) and 7 eastbound, presumably with cargo. Container ships made 15 voyages: 8 eastbound and 7 westbound. General cargo vessels completed 12 voyages: 10 westbound and 2 eastbound. This category includes the vessel Xin Xin Hai 1, which made two voyages carrying containers, although it is formally classified as a general cargo ship. LNG carriers completed 5 voyages: 3 eastbound and 2 westbound. Other vessel types also participated in navigation: fishing vessels made 7 voyages (4 eastbound and 3 westbound), reefer vessels 3 voyages (2 eastbound and 1 westbound), and one research vessel completed an eastbound voyage. Additionally, a supply vessel, a Ro-Ro ship, and a SAR vessel each made one voyage.
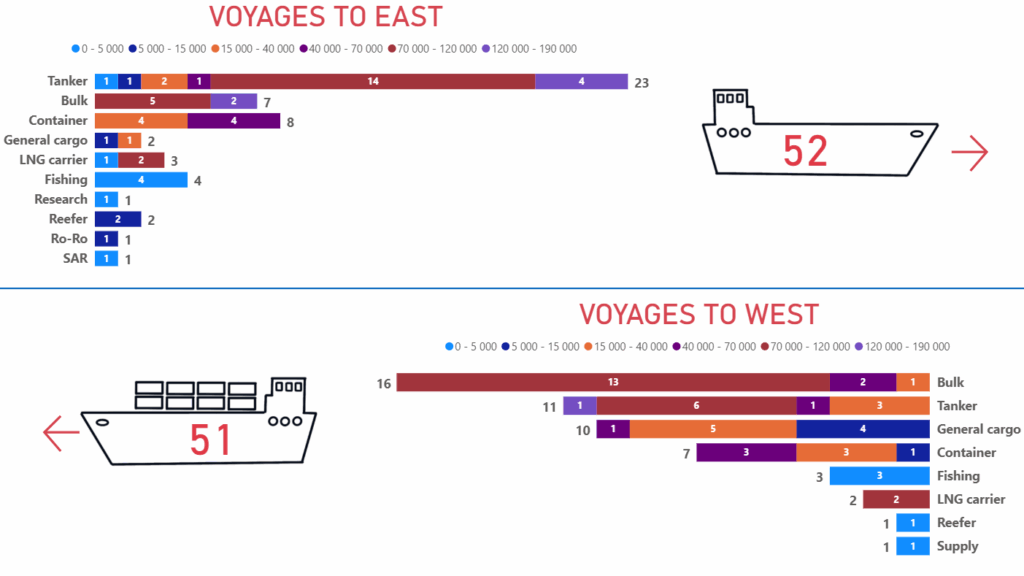
Figure 2. Number of transit voyages and cargo volume on the NSR, 2010–2025.
In 2025, number of transit voyages increased by about 6.2% compared to 2024, while cargo volumes grew by roughly 3.2%. Total deadweight rose slightly by 1%, reaching 6,230,057 tons versus 6,155,353 tons in 2024. This shows that overall traffic remained stable year over year. The detailed deadweight data is presented in the table below.
Summary table: Transit voyages and deadweight by vessel type (2024–2025).
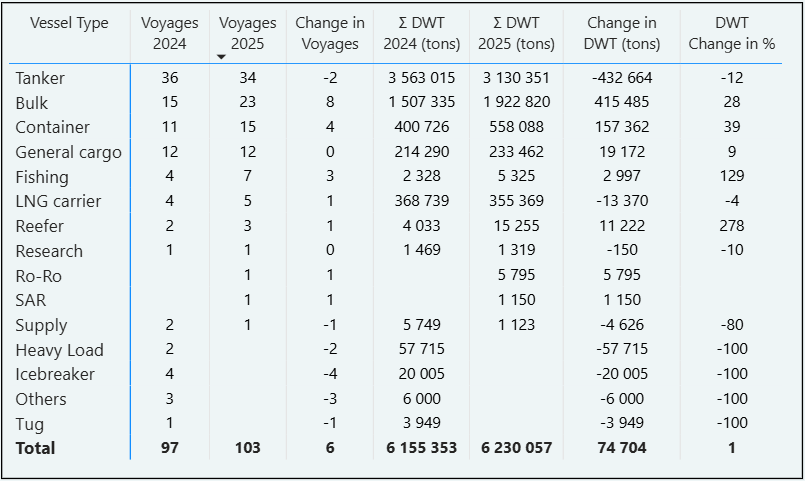
In 2025, the main contributor to growth was bulk carriers, which added 8 voyages (from 15 to 23) and increased their deadweight by 415,485 tons (+28%). Container ships also showed notable growth, with 4 additional voyages (from 11 to 15) and a deadweight increase of 157,362 tons (+39%). General cargo vessels maintained the same number of voyages (12) but grew slightly in tonnage by 19,172 tons (+9%).
Other categories demonstrated mixed trends. Fishing vessels increased from 4 to 7 voyages, adding 2,997 tons (+129%), while tankers declined from 36 to 34 voyages, reducing deadweight by 432,664 tons (–12%). LNG carriers recorded one extra voyage but saw a slight decrease in tonnage (–4%), and reefer vessels grew significantly in tonnage (+278%) despite only one additional voyage. Several categories, including icebreakers, heavy-load vessels, and tugs, recorded no transits in 2025, resulting in a –100% change.
In the following sections, we will examine ice conditions, routes, vessel sizes, directions, and attempt to estimate the volume of cargo transported. All cargo data represent approximate assessments based on previous shipping practices, voyage and vessel characteristics, and information from open sources. For vessels where insufficient data are available, cargo is marked as “unknown.”
Ice conditions
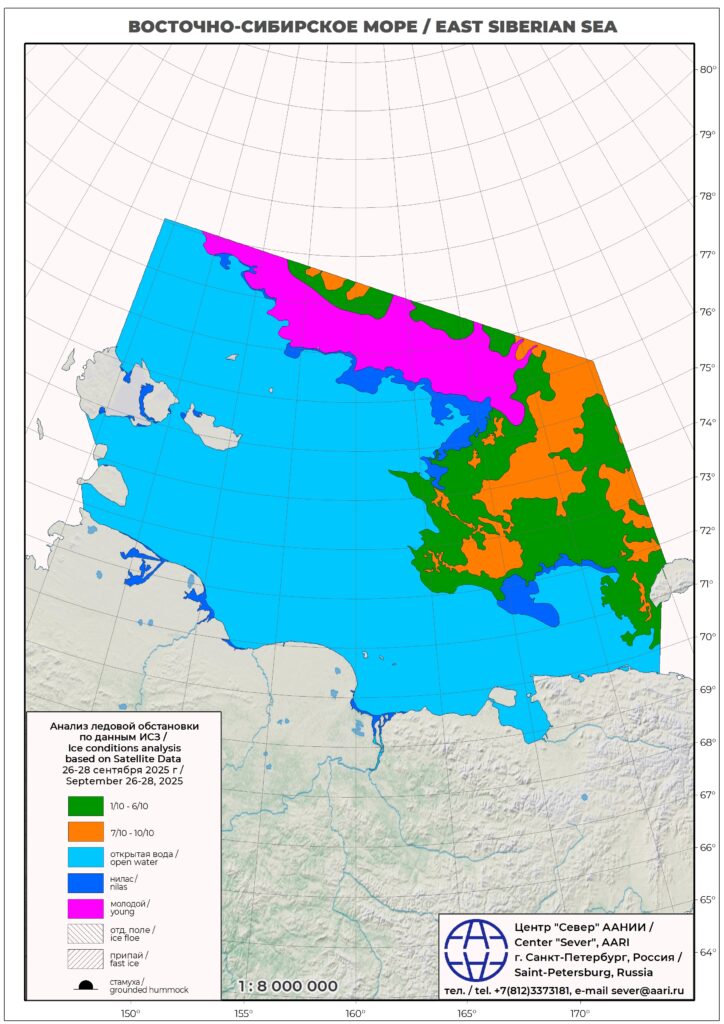
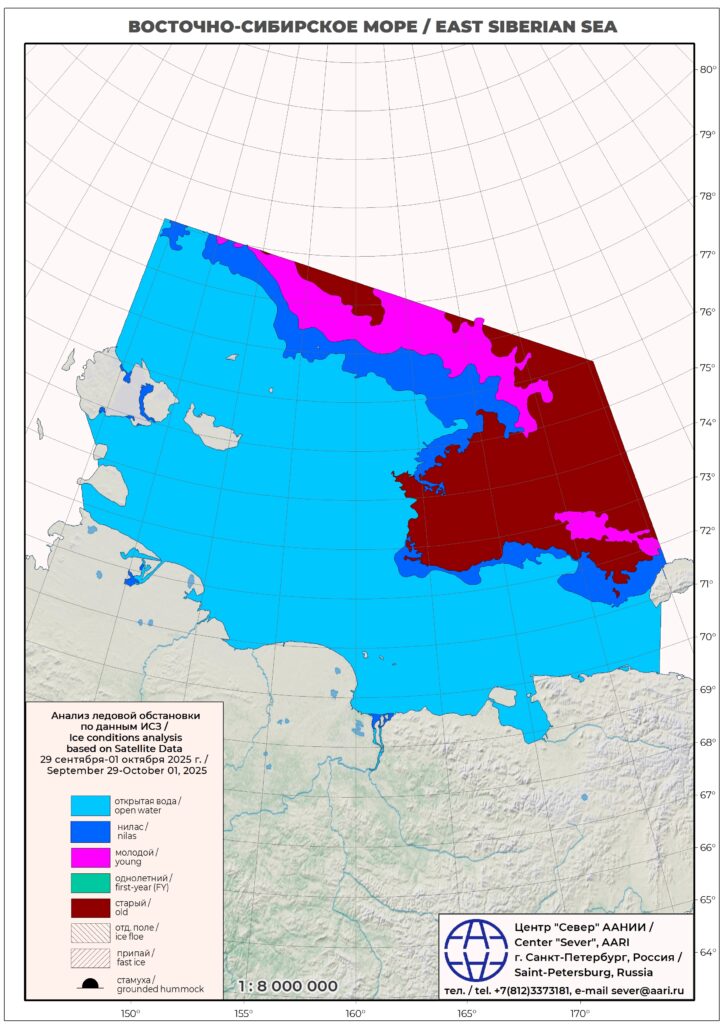
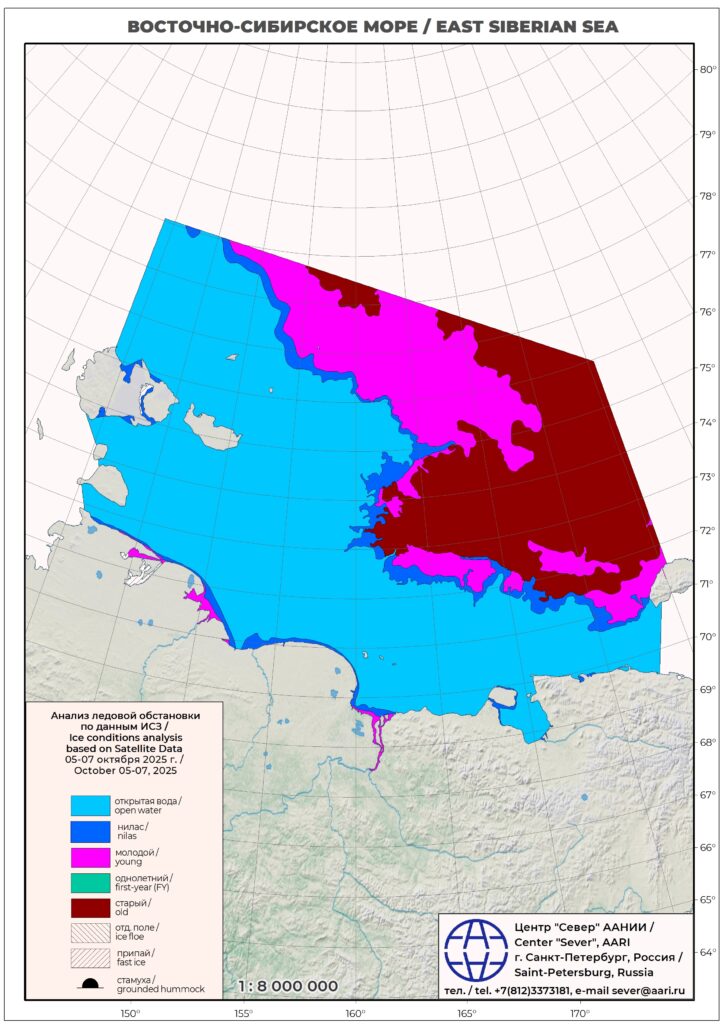
According to the maps presented below, ice conditions along the NSR during the summer–autumn navigation period of 2025 were unfavorable. The open-water period lasted no more than two weeks, occurring at the end of September and the beginning of October. The eastern section of the route remained the most challenging, particularly the East Siberian Sea, where ice persisted for most of the navigation season. An earlier and more intense onset of ice formation was observed in autumn 2025. Ice condition maps were obtained from the official website of the Arctic and Antarctic Research Institute. Below are overview maps for the period from July 1 to November 11, 2025, as well as detailed maps of the East Siberian Sea during the most favorable period late September to early October 2025.
Ice Conditions across the NSR during the summer-autumn navigation season of 2025
Ice Conditions in the East Siberian Sea: September 26–October 11, 2025.

Tankers
We divided all transit tanker voyages along the NSR into 4 groups. The 1st and 2nd groups include large tankers with a deadweight of over 70,000 tons heading east. The 1st group departs from Murmansk, and the 2nd from Baltic ports such as Ust-Luga and Primorsk. These vessels are most likely transporting crude oil. The 3rd group consists of all tankers traveling westbound, probably in ballast. The 4th group includes tankers with a deadweight of less than 70,000 tons heading east. Let’s start by looking at shipments of large crude oil consignments eastbound from the Baltic and from Murmansk.
Map 1. Tankers over 70,000 DWT from Murmansk transiting the NSR eastbound in 2025.
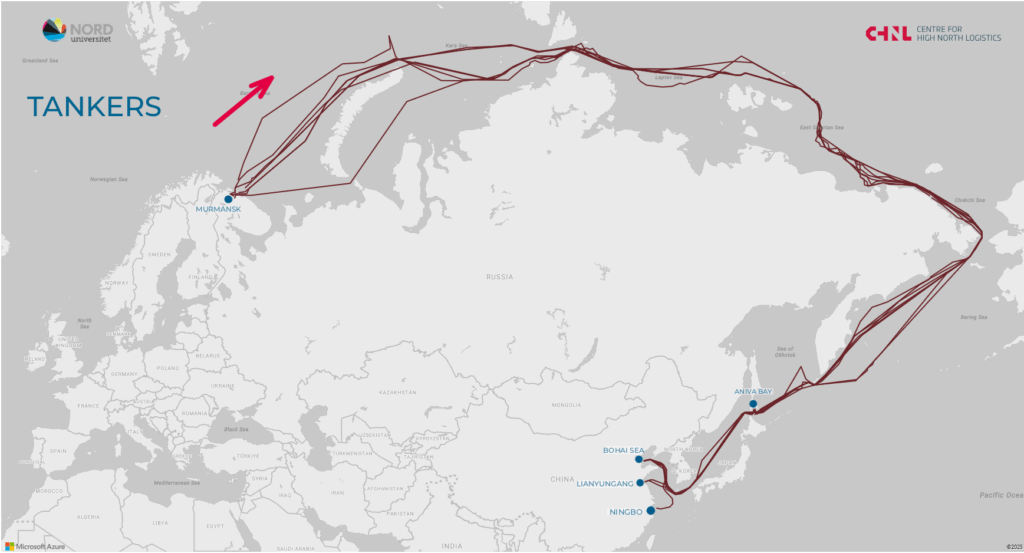
Table 1. Tankers >70,000 DWT from Murmansk eastbound, NSR transit, 2025
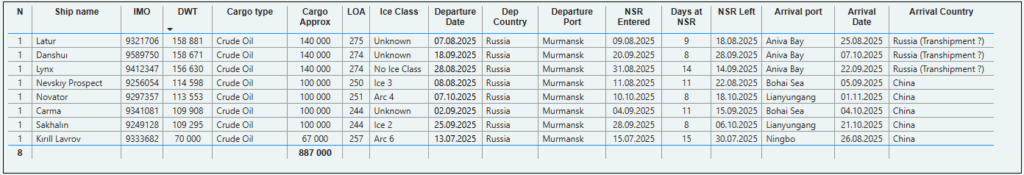
In 2025, we observed a decline in crude oil shipments from Murmansk compared to 2024, when there were 15 voyages. This year, only 8 transit voyages originated from Murmansk. Some destinations remain unclear, with vessels anchoring in Aniva Bay near Korsakov, suggesting possible transshipment for export.
Map 2. Tankers over 70,000 DWT from the Baltic transiting the NSR eastbound in 2025.
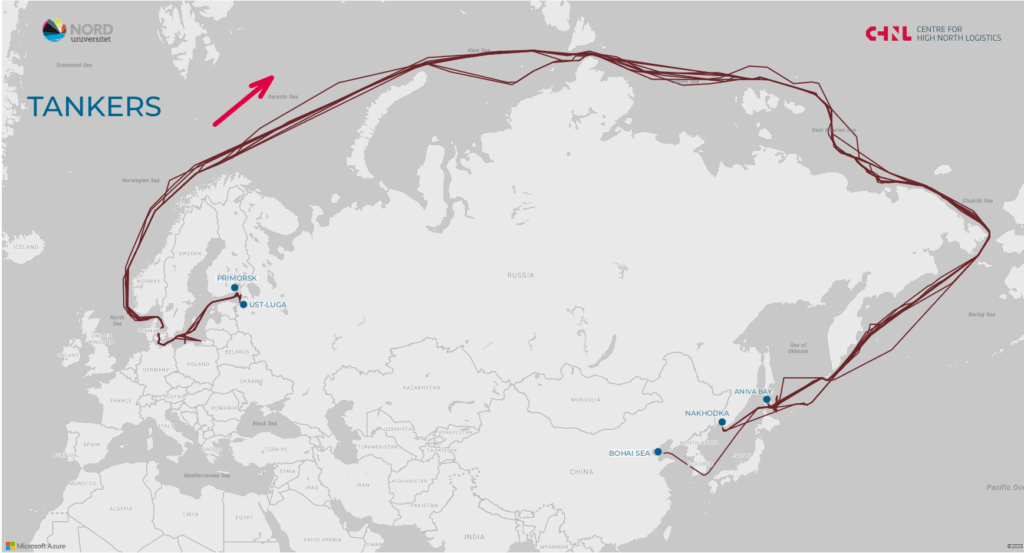
Table 2. Tankers >70,000 DWT from the Baltic eastbound, NSR transit, 2025.
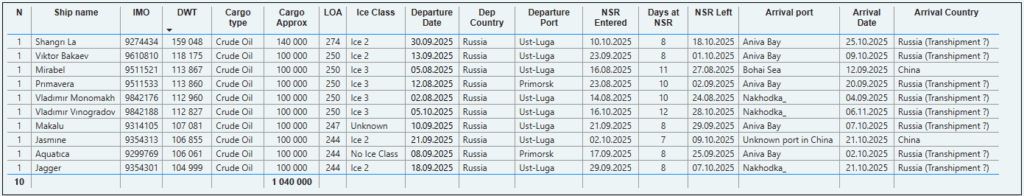
Shipments from Baltic ports (Ust-Luga and Primorsk) increased to 10 voyages in 2025, compared to only 3 in 2024. Most voyages also included stops near Aniva Bay and Nakhodka, likely for transshipment. Overall, we estimate that 18 large tankers transported about 1.9 million tons of crude oil eastbound via the NSR in 2025. This figure is an estimate but close to the data published by Kommersant 1.83 million tons. Now let’s look at the westbound voyages.
Map 3. Tankers transiting the NSR westbound (likely in ballast) in 2025.
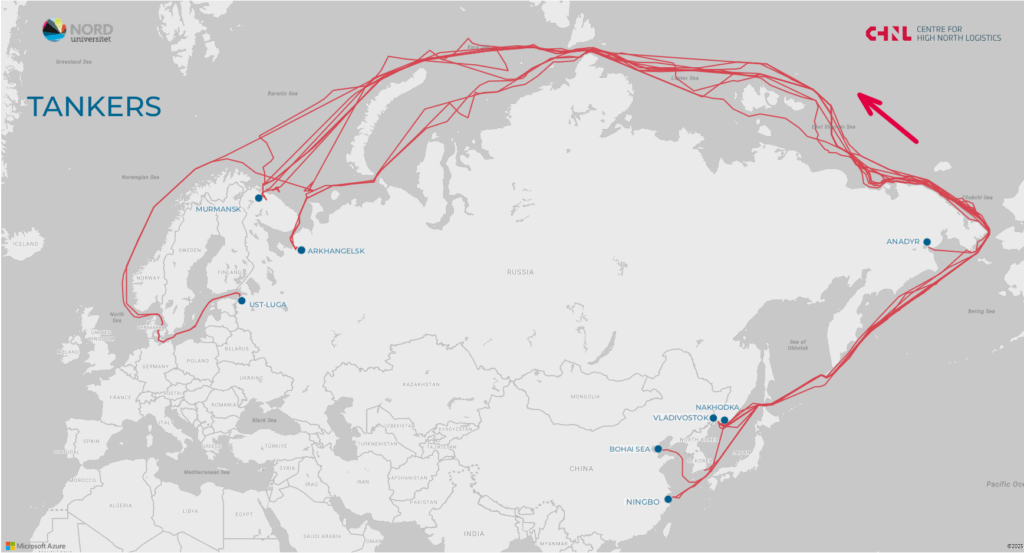
Table 3. Tankers westbound (likely in ballast), NSR transit, 2025.
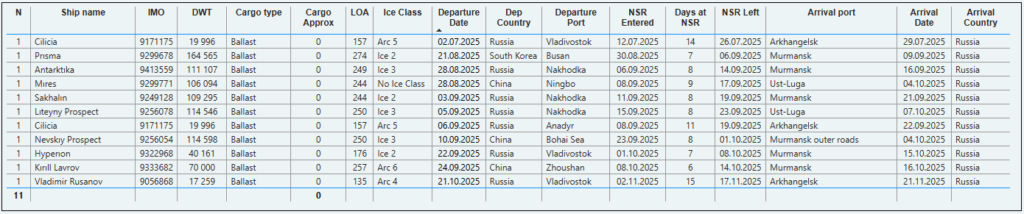
In 2025, 11 tankers traveled westbound along the NSR, most likely in ballast. This pattern suggests these voyages were for repositioning rather than cargo transport. The group included large crude oil and product tankers.
Map 4. Tankers under 70,000 DWT transiting the NSR eastbound in 2025.
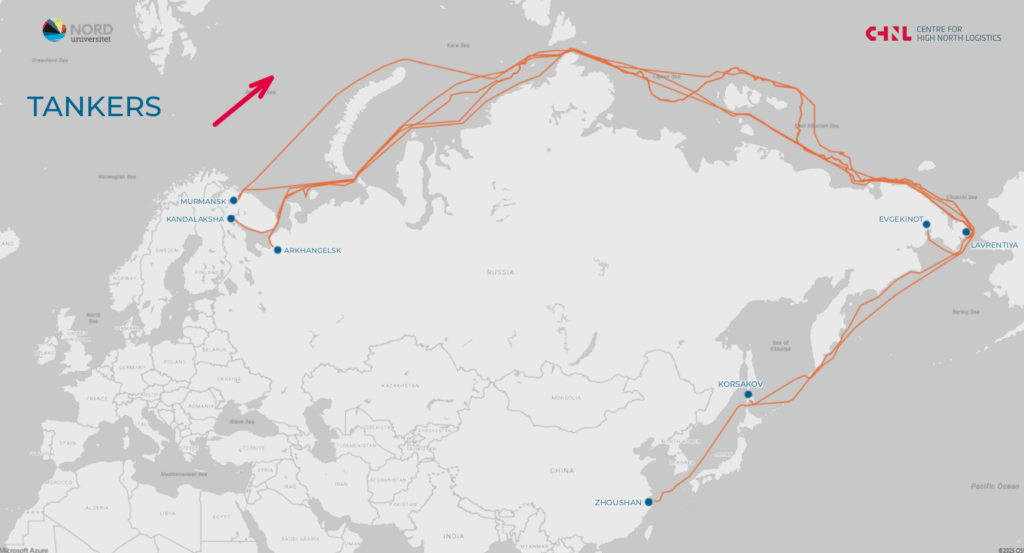
Table 4. Tankers <70,000 DWT eastbound, NSR transit, 2025.
Bulk Carriers
Bulk carrier traffic showed growth in 2025, with 23 voyages recorded: 7 eastbound (likely loaded) and 16 westbound (likely in ballast), involving 18 vessels, 5 of which made two voyages each. For comparison, in 2024 there were only 15 voyages (9 eastbound and 6 westbound).
Map 5. Bulk carriers transiting the NSR eastbound in 2025.
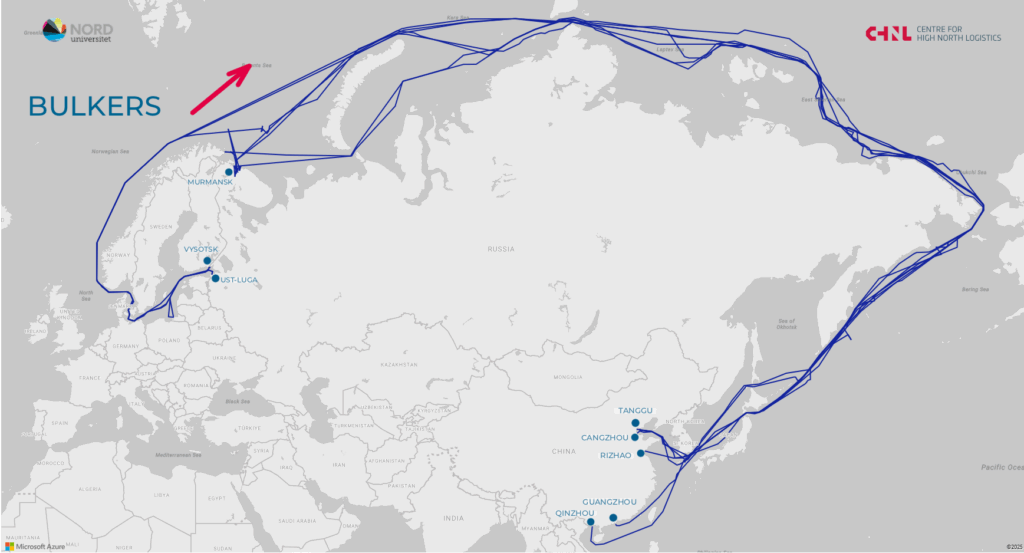
Table 5. Bulk carriers eastbound, NSR transit, 2025.
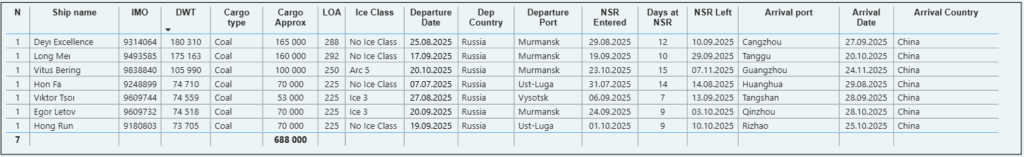
The largest bulk carriers, likely carrying coal, departed from Murmansk, with additional shipments from Ust-Luga and Vysotsk. All eastbound voyages were destined for China. We estimate that these 7 voyages transported just under 700,000 tons of cargo.
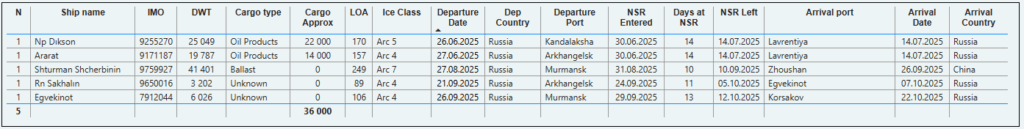
Map 6. Bulk carriers transiting the NSR westbound in 2025.
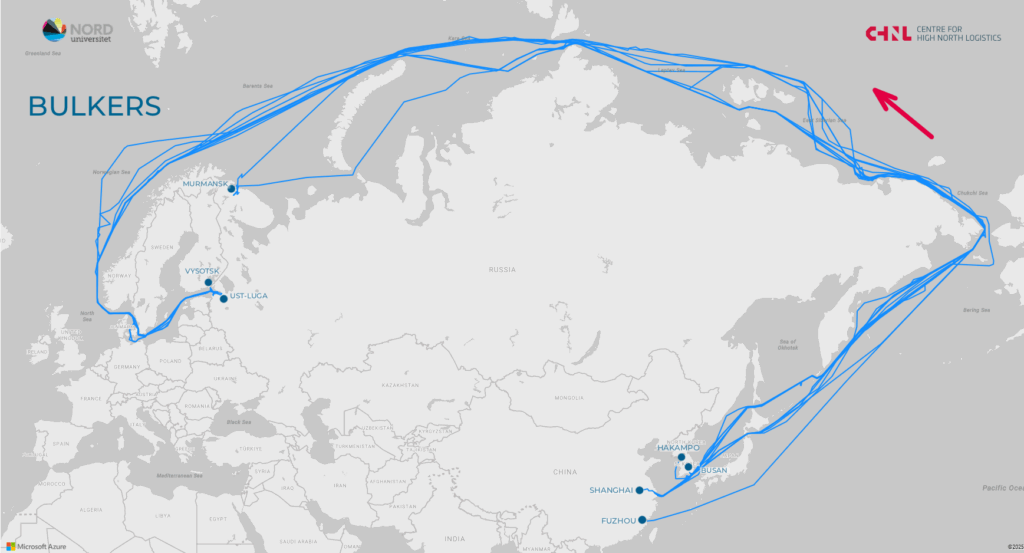
Table 6. Bulk carriers westbound, NSR transit, 2025.
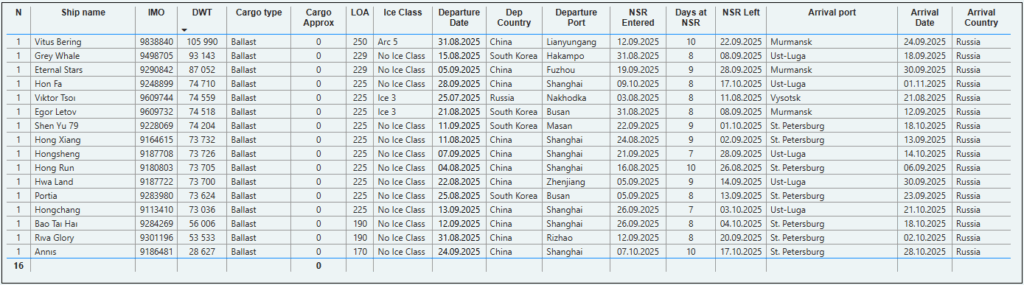
Westbound voyages originated mainly from China (11 voyages), South Korea (4 voyages), and Russia (1 voyage). Most vessels lacked ice-class certification, suggesting one-off Arctic transits. However, 5 vessels completed 2 NSR voyages during the season. This indicates that the NSR is increasingly used for repositioning bulk carriers between regions. Importantly, this westbound group accounted for the largest increase in total deadweight among all transit vessel categories.
Container Ships
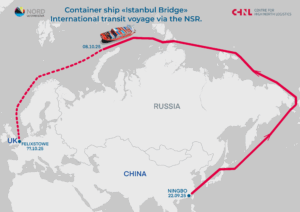
In 2025, the number of container ship transit voyages along the NSR increased. We counted 15 such voyages. For comparison: last year there were 11 container ship voyages. The key Russian port remains St. Petersburg, while China dominates the eastern end. Notably, in 2025 there was a true international transit voyage from China to the UK. We published a separate article about this voyage.
In November 2025, Rosatom CEO Alexey Likhachev announced that the volume of container cargo transiting the NSR reached a record 400,000 tons. We do not know exactly which ships and voyages were included in this figure. Our approximate estimate for container ship cargo, including two voyages by the general cargo vessel Xin Xin Hai 1, is about 287,000 tons. It is possible that additional containerized cargo was transported on other general cargo vessels, for which we have no detailed information.
Map 7. Container ships transiting the NSR eastbound in 2025.
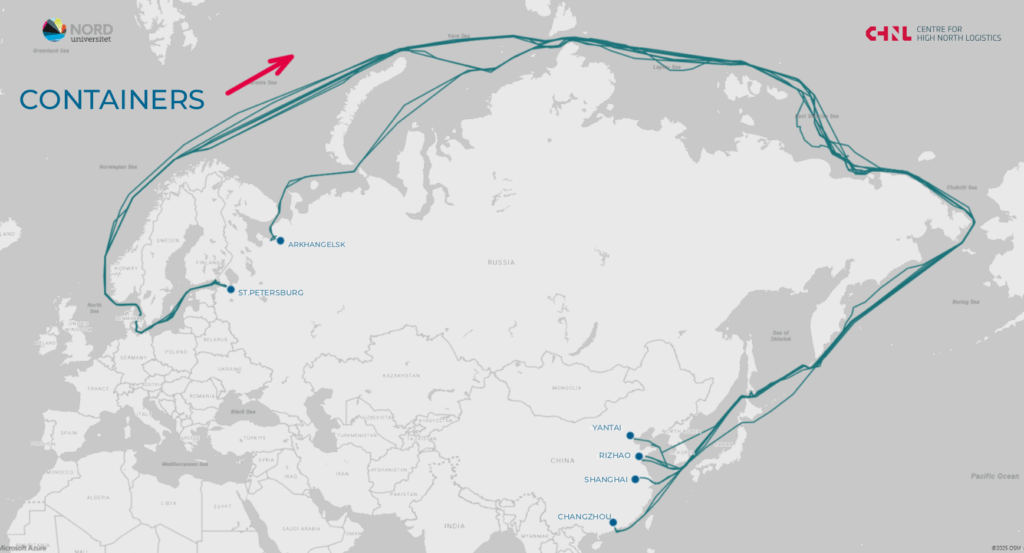
Table 7. Container ships eastbound, NSR transit, 2025.
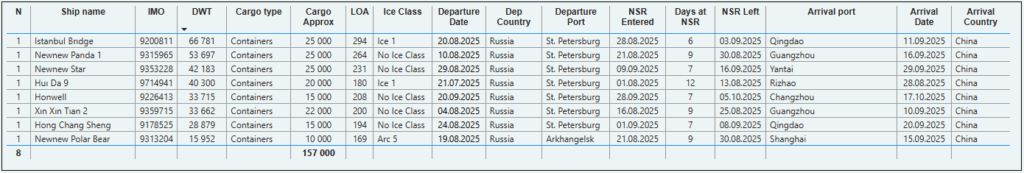
Map 8. Container ships transiting the NSR westbound in 2025.
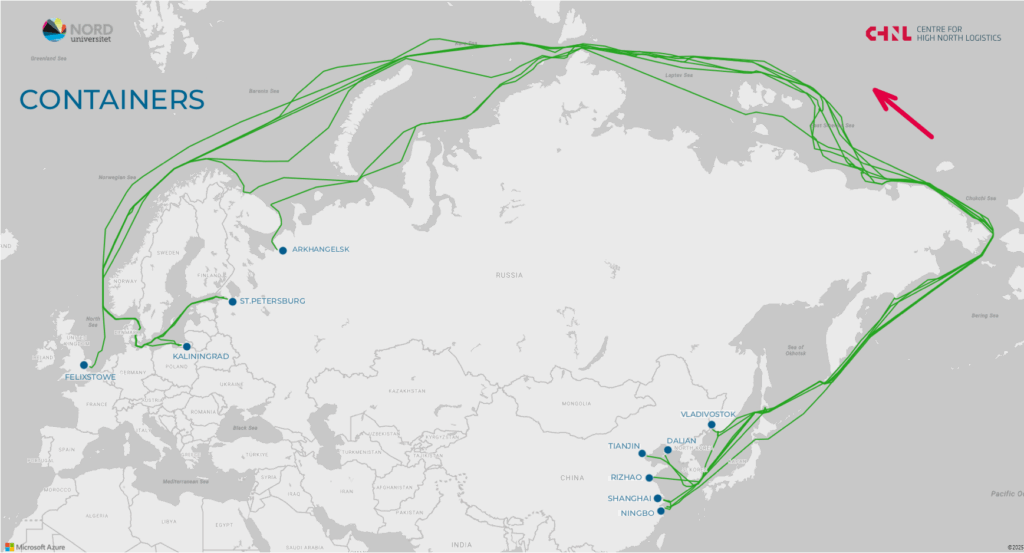
Table 8. Container ships westbound, NSR transit, 2025.
General Cargo Ships
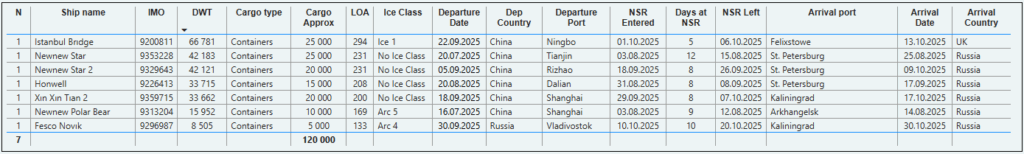
General cargo traffic in 2025 remained at the same level as the previous year, with 12 voyages: 10 westbound and 2 eastbound. Eight voyages originated from Chinese ports to western Russia, one from Busan to St. Petersburg, and 3 from Russian ports (two to China and one domestic). Cargo details remain unclear, but these vessels may have carried containerized goods included in Rosatom’s overall figures.
Map 9. General cargo ships transiting the NSR in 2025.
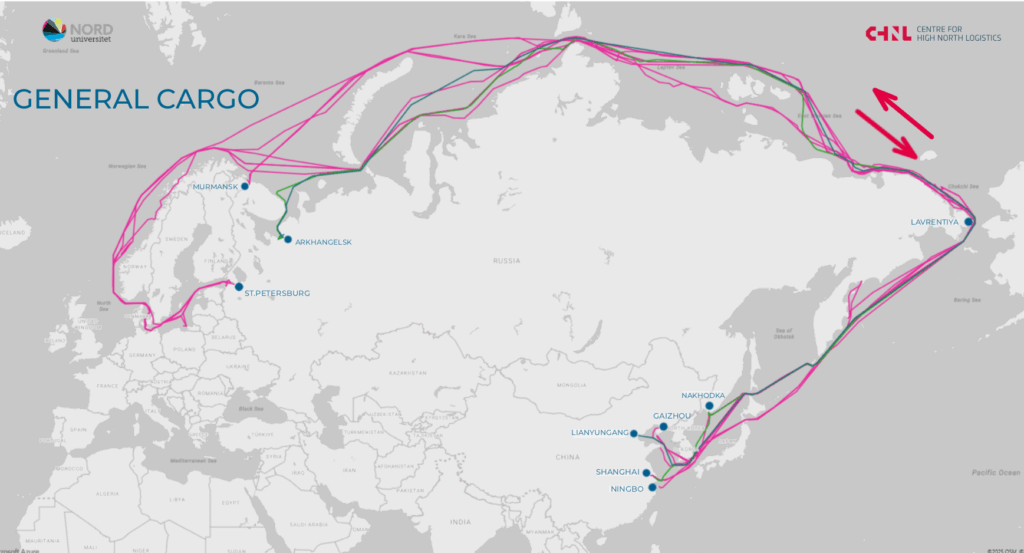
Table 9. General cargo ships, NSR transit, 2025.
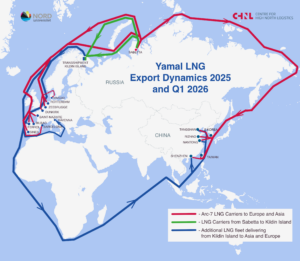
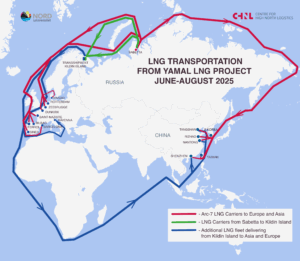
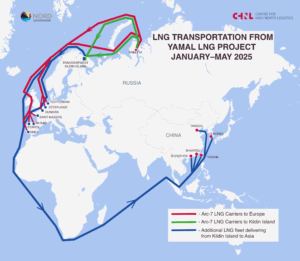
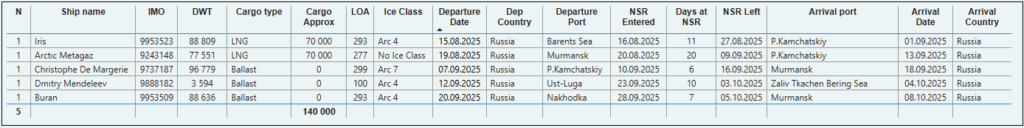
LNG Carriers
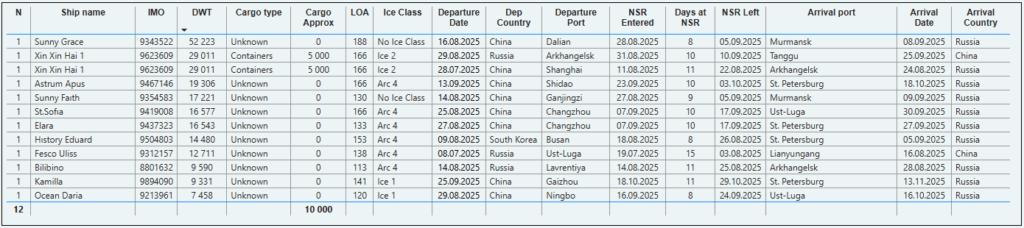
In 2025, 5 LNG carriers completed transit voyages along the NSR. Four of these were linked to the Arctic LNG 2 project: two carried LNG cargo eastbound in August, while the other two were westbound return voyages. Additionally, the small LNG bunker vessel Dmitry Mendeleev was repositioned from Ust-Luga to the Bering Sea area.
Map 10. LNG carriers transiting the NSR in 2025.
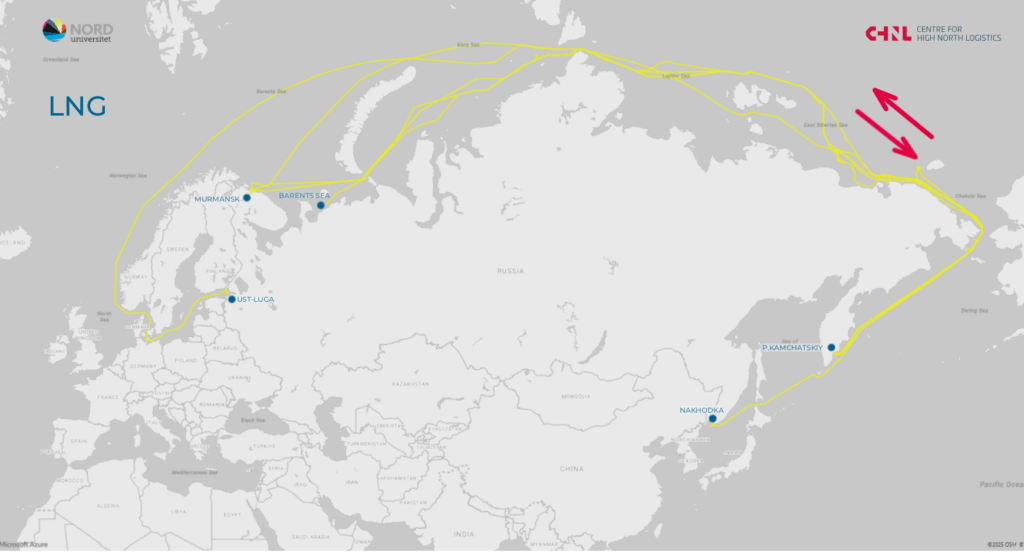
Table 10. LNG carriers, NSR transit, 2025.
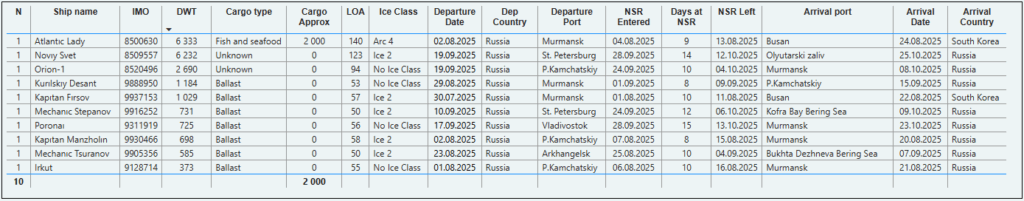
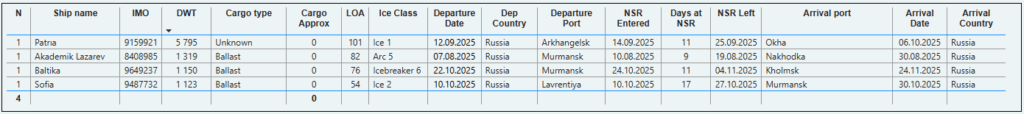
Fishing and Reefer Vessels
This category includes vessels under 10,000 DWT. Most used the NSR to change operating regions, with some possibly carrying small cargo volumes. Nearly all voyages were between Russian ports, except for 2 international trips.
Map 11. Fishing and Reefer vessels transiting the NSR in 2025.
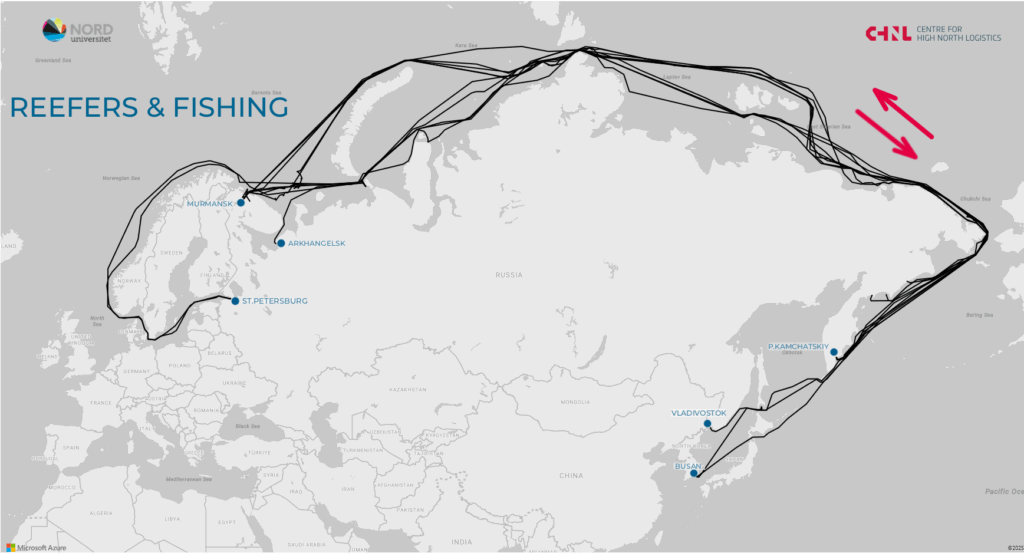
Table 11. Fishing and Reefer vessels, NSR transit, 2025.
Other Vessels
This category includes four types of ships: Research, Supply, SAR and Ro-Ro ship. Each of them made one transit voyage along the NSR in 2025. These voyages are isolated cases. The share of such vessels in the overall transit flow is minimal, but their presence highlights the multifunctionality of the route.
Map 12. Other vessels (SAR, supply, research, Ro-Ro) transiting the NSR in 2025.
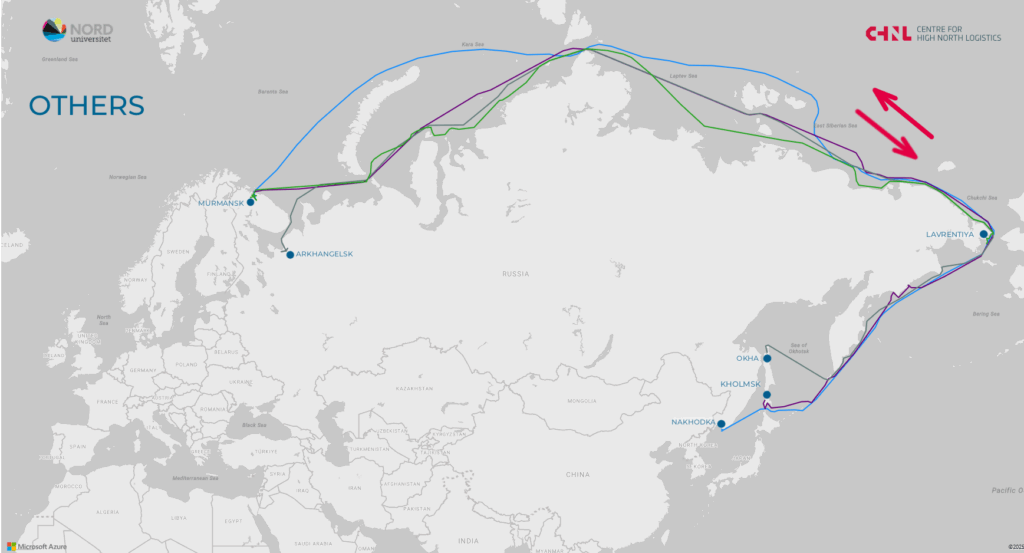
Table 12. Other vessels (SAR, supply, research, Ro-Ro), NSR transit, 2025.
Conclusions
Based on the results of the 2025 transit navigation season, crude oil tanker shipments remain the dominant cargo on the NSR. Some voyages were directed to China, while others involved crude oil deliveries with possible transshipment in eastern Russia. According to Kommersant, the total volume of crude oil transported eastbound via the NSR declined from 1.91 million tons in 2024 to 1.83 million tons in 2025
In the bulk carrier segment, we observed cargo flows from Russia to China and an increased number of ballast voyages from China to Russia.
Container traffic showed an upward trend compared to 2024, with most voyages between Russian and Chinese ports, except for one shipment from China to the United Kingdom.
We believe that for most transit voyages described above, the NSR serves as an occasional alternative to the main route during the summer–autumn navigation period. These cargo flows exist year-round but typically follow traditional routes, with a portion switching to the NSR for one or two voyages in summer to save time. This review focuses exclusively on transit voyages, while the core cargo flow on the NSR remains the year-round export of raw materials from Arctic oil and gas projects.
The full list of transits is available for download at the link below.