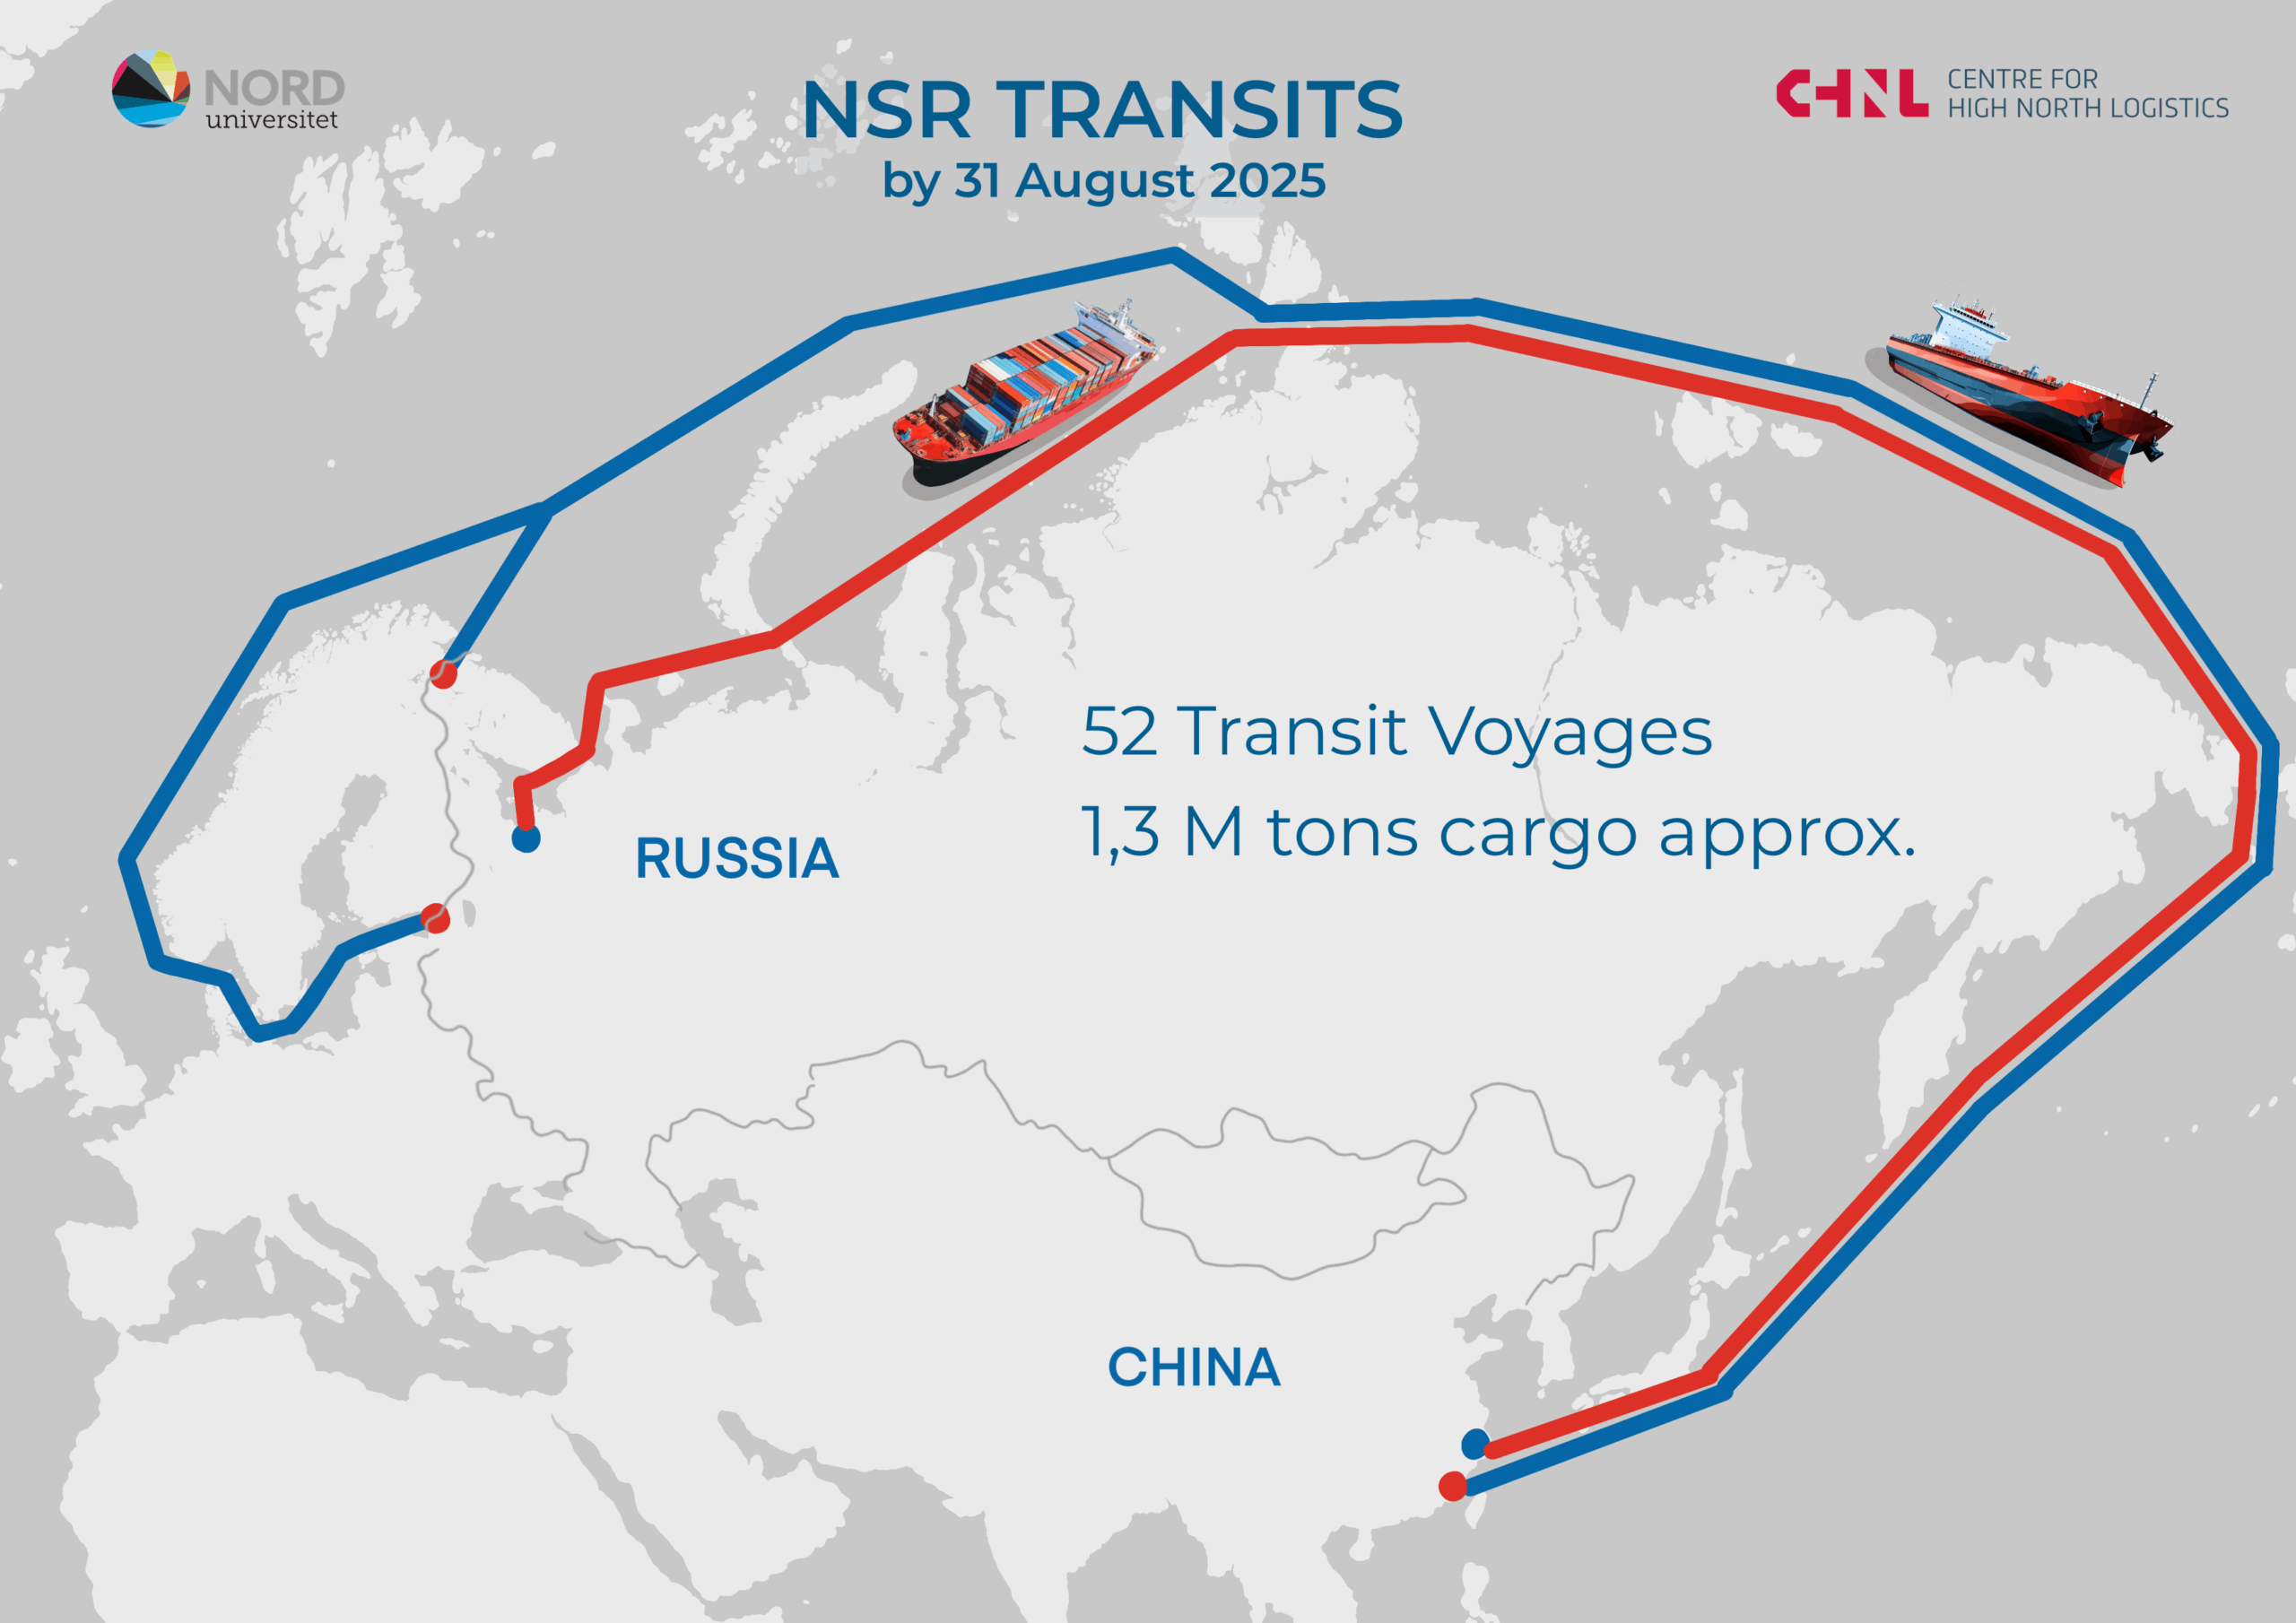
This publication is based on satellite AIS data on vessel movements. It covers the first half of the summer-autumn navigation season from June to August. The report includes transit* voyages along the NSR that began by August 31, 2025. All other types of traffic within the NSR area are not included. All maps with vessel tracks and tables with voyage data are current as of August 31, 2025. Some data, such as the destination port for ongoing voyages, may change as those voyages are completed.
During the reporting period, ice remained present in the NSR area, with a gradual melting process underway. By the end of August, residual ice was still observed in the eastern part of the East Siberian Sea, which may influence route selection, particularly considering the vessel’s draft.
Figure 1. Ice melting dynamics from June to August 2025.
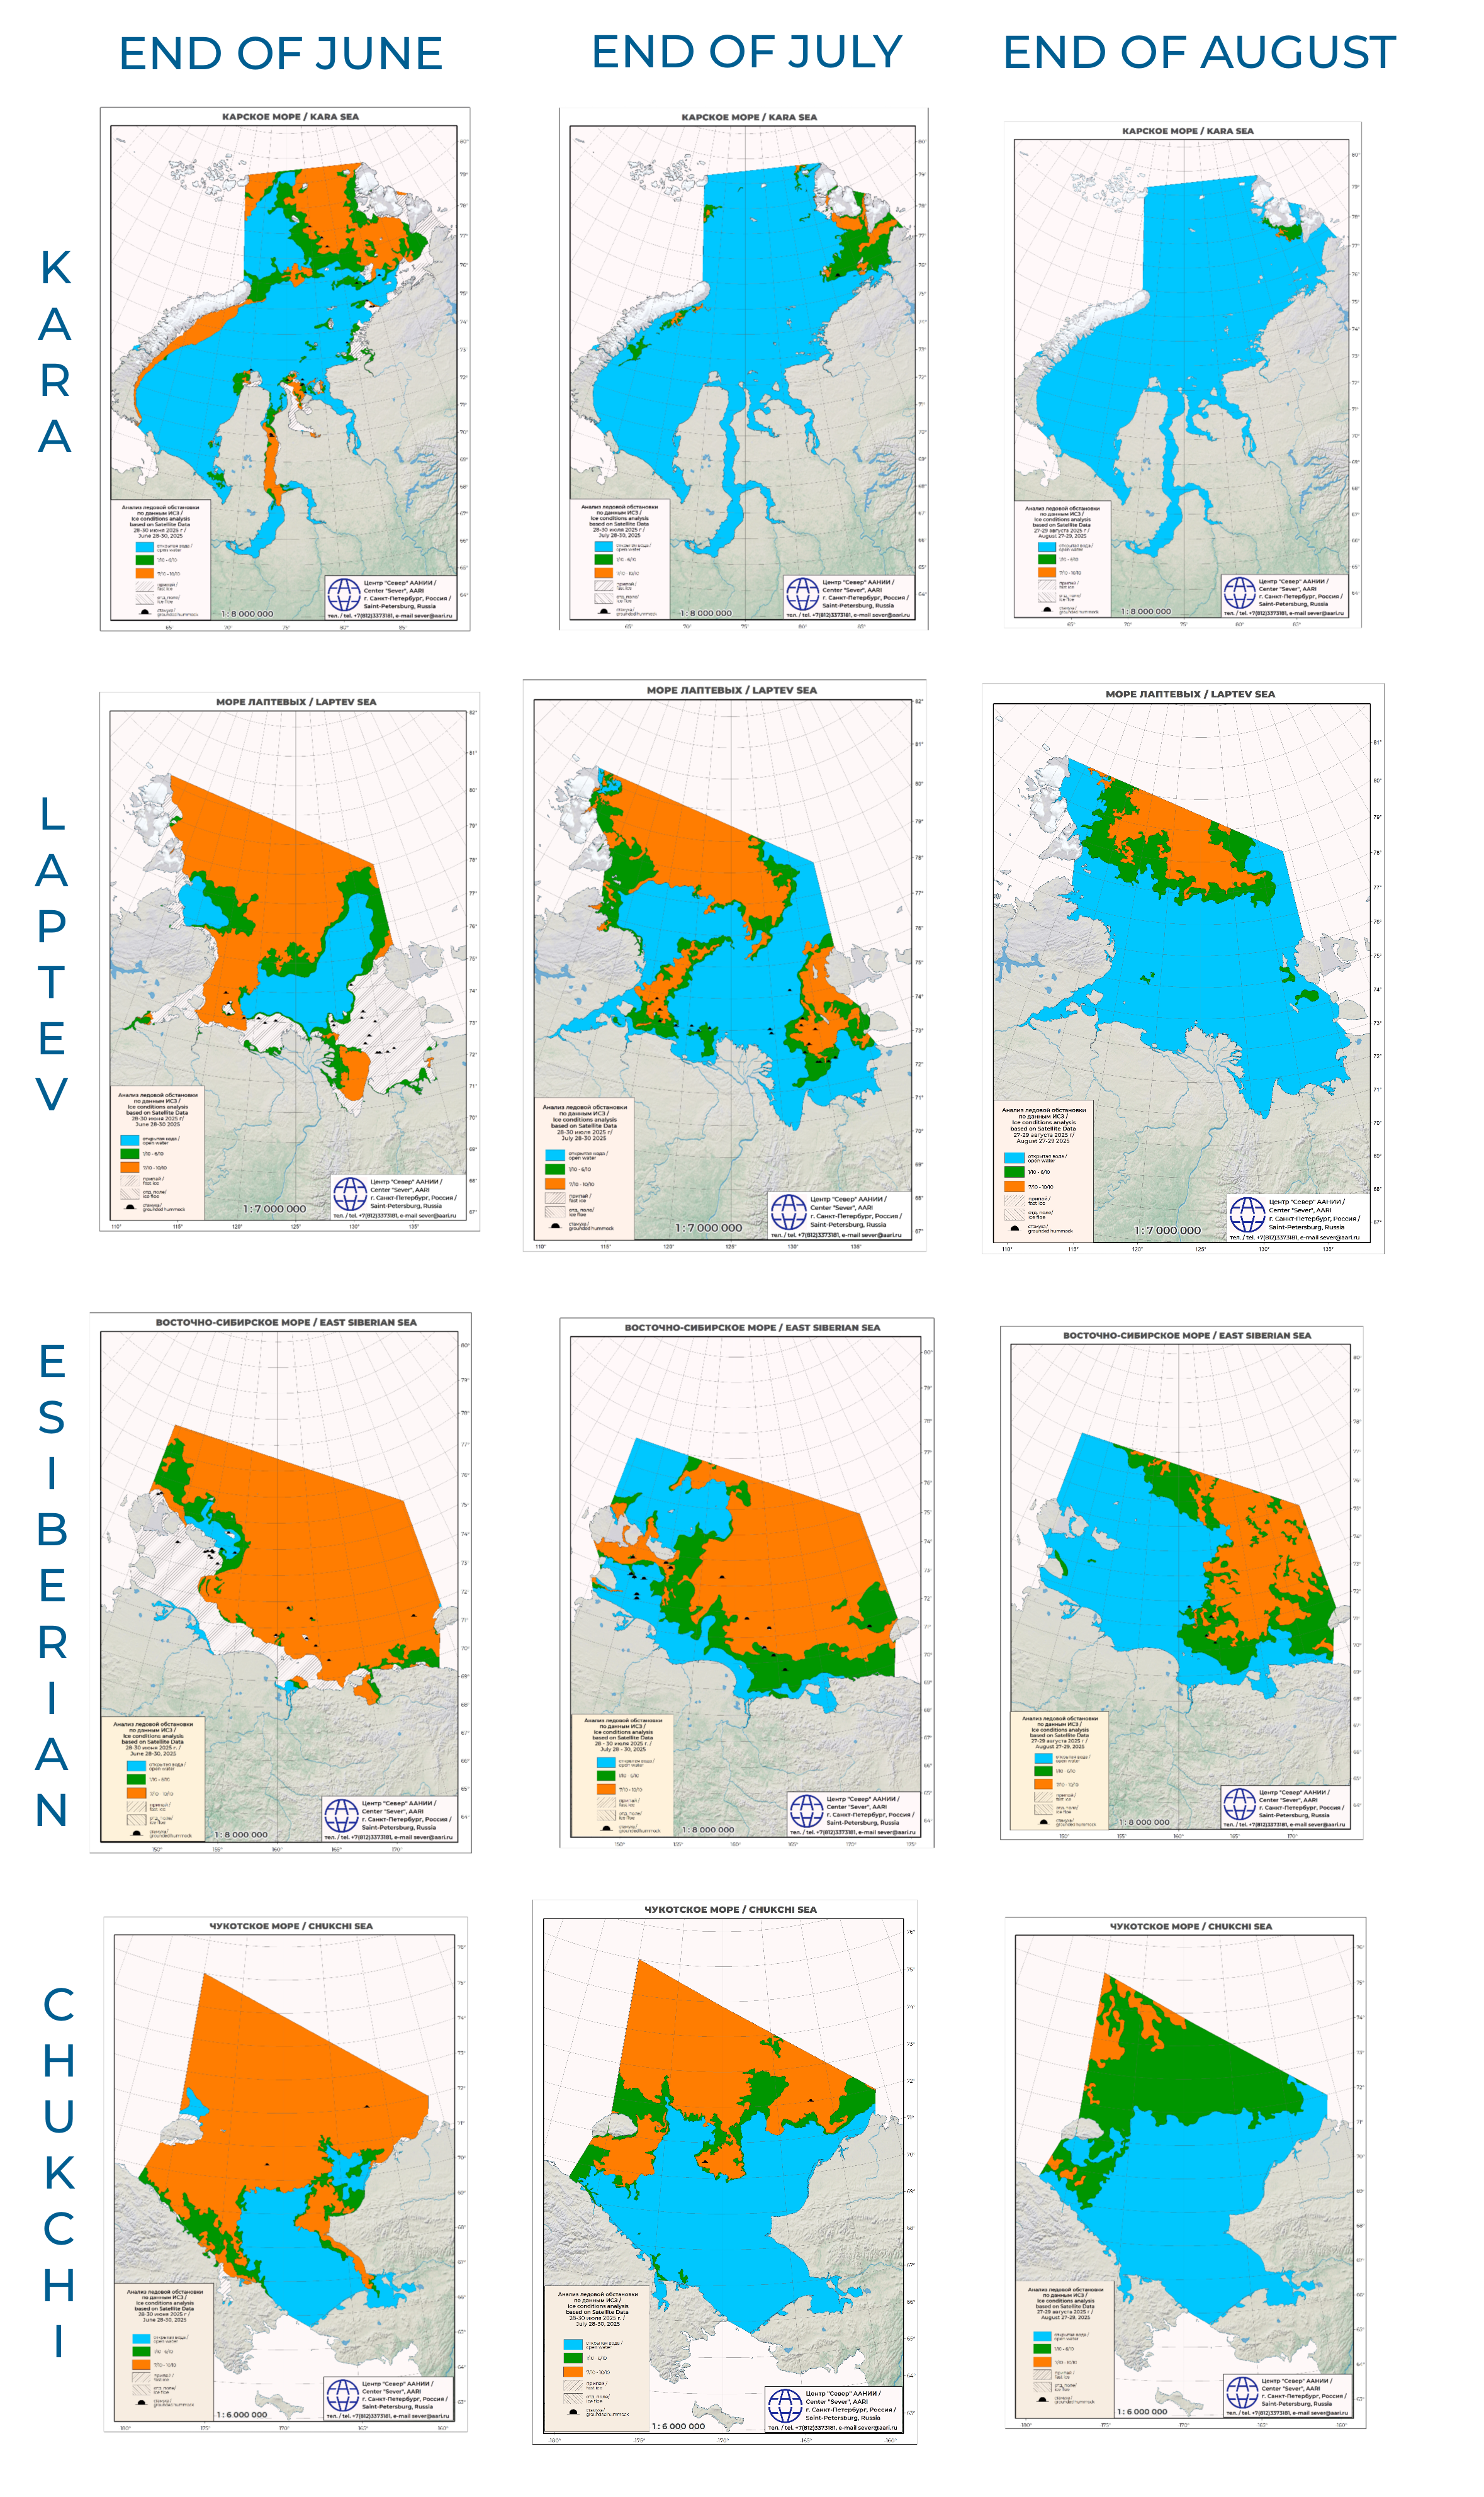
Source: https://nsr.rosatom.ru/navigatsionnaya-i-gidrometinfomratsiya/karty-ledovoy-obstanovki/
Number of voyages
The current quantitative assessment of transit voyages is considered interim, as the situation continues to evolve. The main purpose of this publication is to provide a general overview of the volume of transit traffic, highlight main shipping directions and identify vessel types.
We have divided the voyages into four categories: completed voyages – vessels that departed from their port of origin, transited NSR, and arrived at destination port; concluding voyages – vessels that have already completed the NSR part of the transit and are en route to their destination port; voyages within the NSR waters – vessels currently sailing in the NSR water area and continuing their transit passage; started transit voyages – vessels that, at the time of publication, had already departed from their ports of origin but had not yet entered the NSR area. These vessels have received permits from the Rosatom Northern Sea Route General Administration and are highly likely to complete a transit passage. These voyages are also included in the overall statistics.
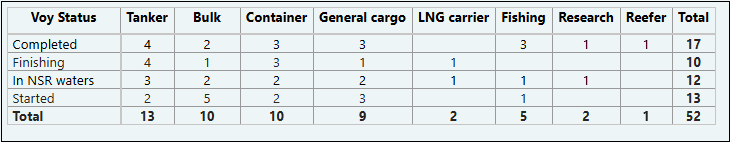
In total, we have recorded 52 voyages, including 17 completed voyages, 10 that are nearing completion, 12 currently within the NSR area, and 13 recently initiated voyages. The data by voyage category is presented in Table 1.
Table 1 Number of transit voyages by vessel type and voyage status.
Distribution by direction and vessel type
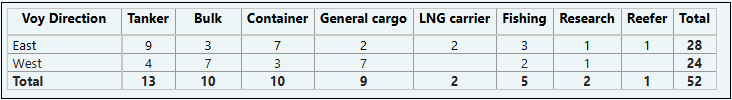
In terms of direction, the vessels are distributed fairly evenly: 28 vessels are heading eastward, and 24 are heading westward. By vessel type, we have recorded 13 tankers, 10 bulk carriers, 10 container ship voyages, 9 general cargo ship voyages, 2 LNG tanker voyages, 2 research vessel voyages, 5 fishing vessels, and 1 voyage by a refrigerated cargo ship.
Table 2 Number of transit voyages by vessel type and voyage direction.
Cargo Status**
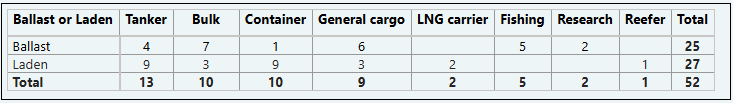
According to our estimates, 25 vessels are sailing in ballast, while 27 vessels are carrying cargo. The total estimated cargo volume at this stage may amount to approximately 1.3 million tons.
Table 3 Number of transit voyages by vessel type and cargo status.
Compared to data from the same period in 2024, we observe a slight increase in the total number of voyages. According to our records, by the end of August 2024, 45 transit voyages had been initiated, with a total cargo volume of approximately 1.4 million tons. Overall, the number of voyages and the estimated cargo flow are comparable to last season. The cargo structure in 2025 also appears similar to what we observed in 2024. We will now take a closer look at traffic by the main vessel types.
Tankers
Out of 13 tankers, 9 are heading eastward, and we assume that all of them are carrying cargo. 4 of these tankers departed from Murmansk, 2 from Ust-Luga, and 1 each from Primorsk, Kandalaksha, and Arkhangelsk. The remaining 4 tankers are heading westward, most likely in ballast. The list of tanker voyages is presented in Table 4.
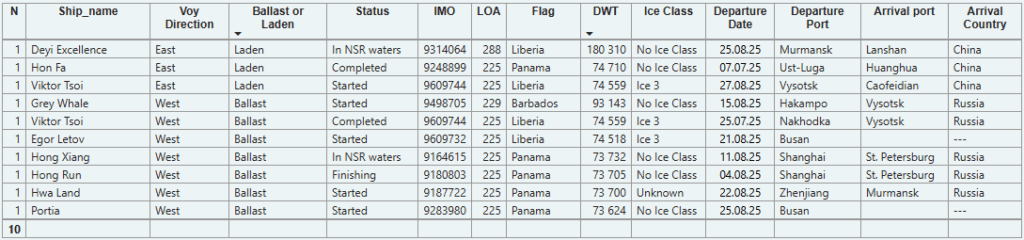
Table 4 List of transit voyages by tankers.
The estimated volume of liquid cargo may amount to up to 740,000 tons of crude oil and 40,000 tons of petroleum products. Some of the eastbound voyages in this category are still ongoing, but it appears that most of them are heading toward China.
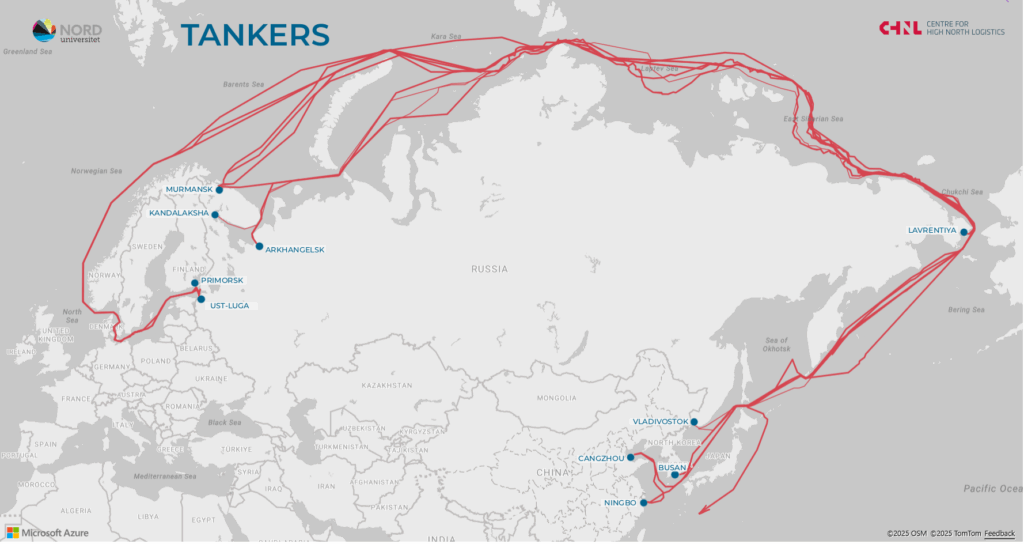
Map 3 Tracks of tankers transiting the Northern Sea Route.
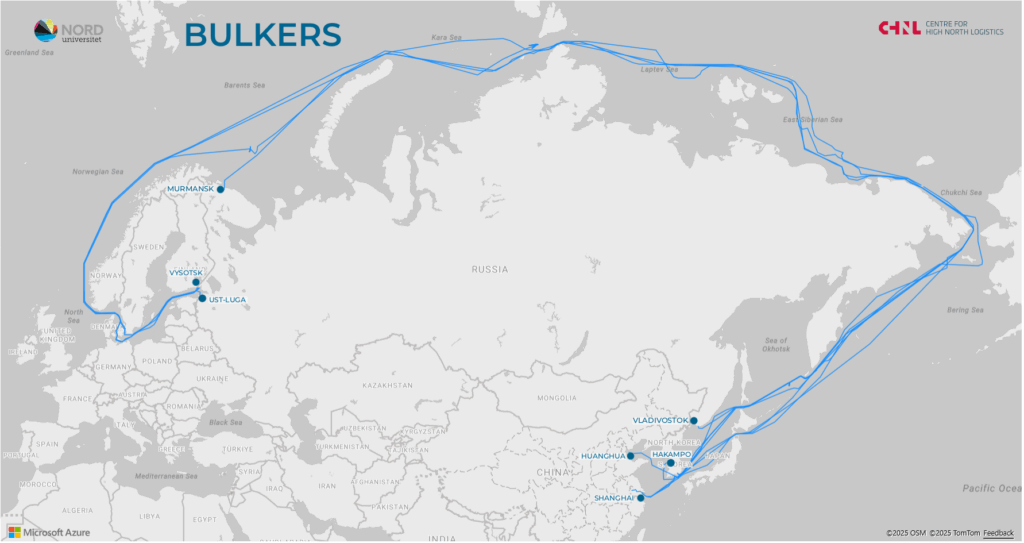
Bulk Carriers
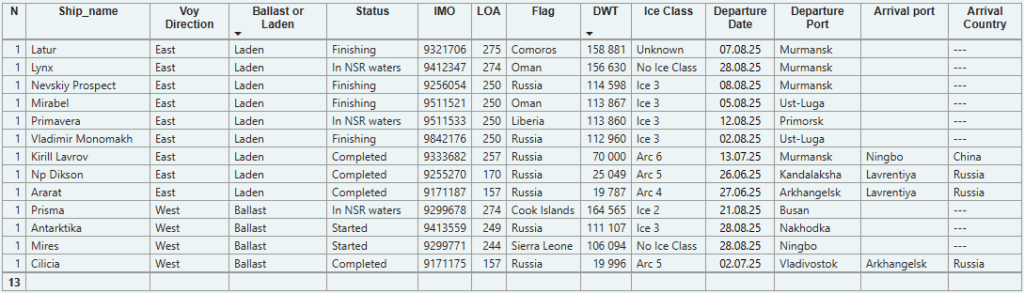
We have recorded a total of 10 transit voyages by bulk carriers. Unlike tankers, the majority of these vessels 7 out of 10 are sailing westward in ballast. Only 3 vessels are heading eastward with cargo. The largest bulk carrier, with a deadweight of 180,000 tons, departed from Murmansk. The other two, each with a deadweight of 74,000 tons, departed from Ust-Luga and Vysotsk, respectively. The estimated volume of bulk cargo may be around 290,000 tons.
Table 5 — List of transit voyages by bulk carriers.
Map 4 Tracks of bulk carriers transiting the Northern Sea Route.
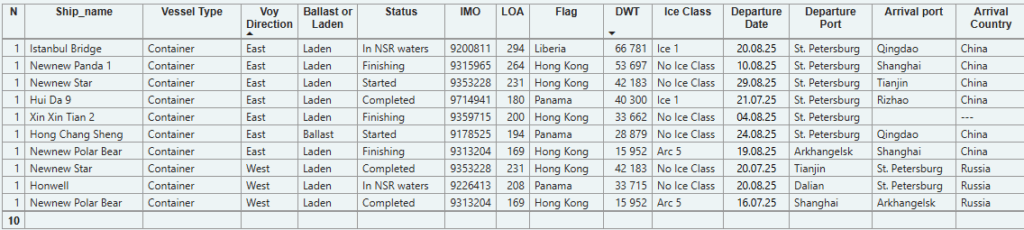
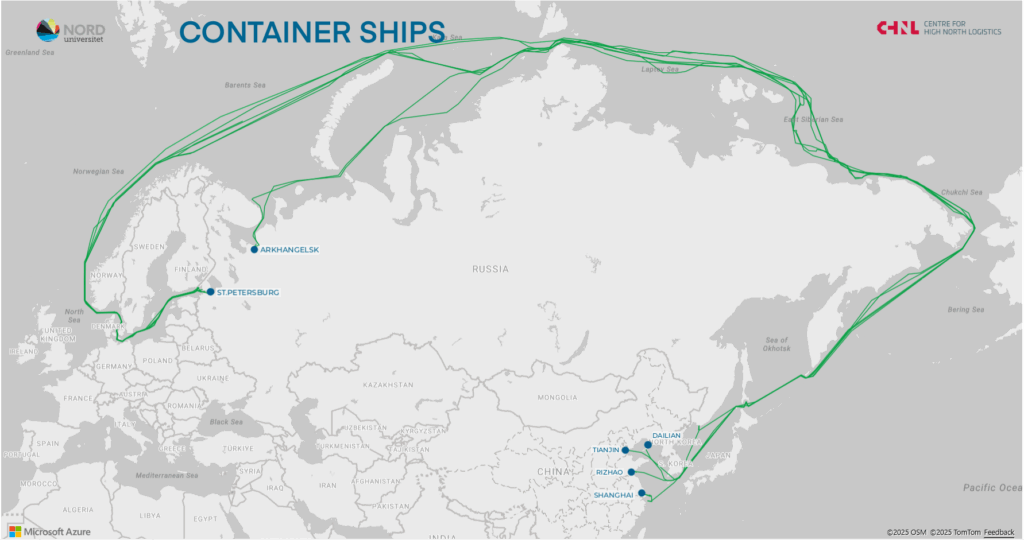
Container Ships
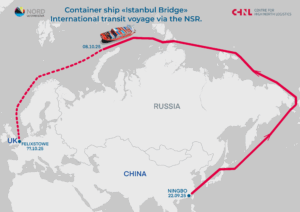
By the end of August, we recorded 10 container ship voyages. Of these, 7 were eastbound: 6 departed from the port of Saint Petersburg and 1 from Arkhangelsk. In the opposite, westbound direction, 3 voyages departed from China, 2 of them bound for Saint Petersburg and 1 for Arkhangelsk. We assume that the vast majority of these voyages are carrying cargo, with an estimated total volume of approximately 150,000 tons. It is worth noting that the container traffic so far is exclusively between Russia and China.
Table 6 — List of transit voyages by container ships.
Map 5 Tracks of container ships transiting the Northern Sea Route
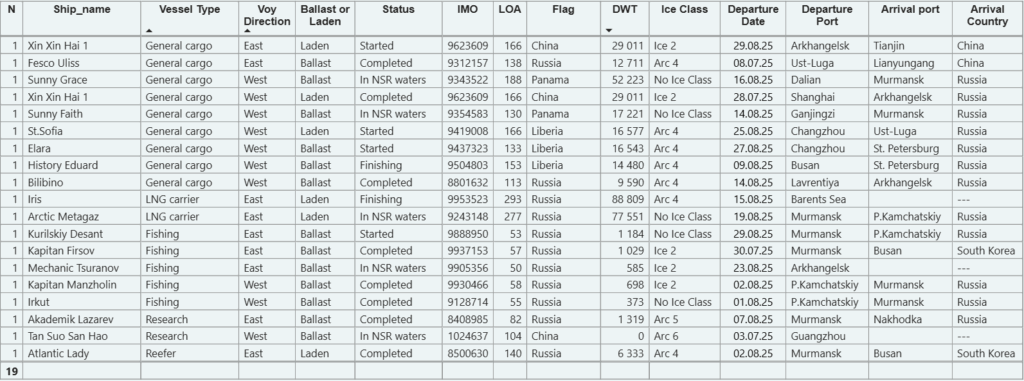
Other ship types
This group includes 19 voyages by various types of vessels. The total estimated cargo volume may be around 150,000 tons. Among them are 9 voyages by general cargo ships, most of which were westbound in ballast. An exception is the vessel Xin Xin Hai 1, with 2 voyages transporting container cargo between China and Arkhangelsk.
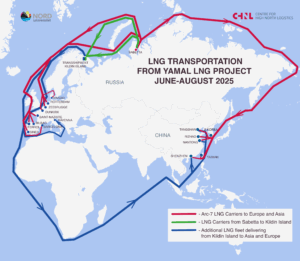
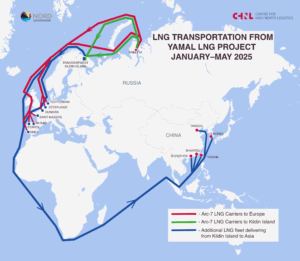
We also recorded 2 voyages by LNG tankers. Both departed from the Barents Sea region and are most likely carrying LNG with a total estimated volume of approximately 130,000 tons.
Additionally, there were 5 voyages by fishing vessels and 1 voyage by a refrigerated cargo ship. Apart from cargo vessels, there were also 2 transit passages by research vessels – one of which has already completed its voyage, while the other is currently located within the NSR area.
Table 7 List of transit voyages by other ships.
Conclusions
Based on the information presented above, we can conclude that the main transit cargo flow in 2025, as in 2024, is eastbound – from Russia to China.
The primary cargo is crude oil, which accounts for approximately 54% of the total volume. This is followed by bulk cargo at 21%, other cargo types (including general cargo, LNG, and oil products) at 14%, and container cargo at around 11%. So far this year, we have observed an increase in container traffic.
Westbound shipments represent only about 3% of the total estimated cargo volume.
The upcoming months – September, October, and, for some vessels, November represent active period of the NSR transits. Monitoring will continue, and a final summary of the 2025 NSR transit season is scheduled for publication in December.
*In this article, the term “transit voyage” refers to a vessel passing through the NSR area without calling at ports within the NSR and crossing both the western and eastern boundaries of the route. In cases where a vessel made stops or drifted within the NSR water area without entering a port, we also classify such voyages as transit.
**The data on cargo type and volume presented in this article are based on preliminary estimates. These estimates are derived from vessel characteristics (such as DWT, ship type and draft), voyage patterns, historical data on similar shipments, and publicly available media reports. Final and verified figures on the volume of transit cargo are typically published by the Rosatom Northern Sea Route General Administration upon completion of the navigation season.