Key Results
As of September 30, 2026, we had identified 104 confirmed NSR transit voyages, already exceeding the 103 transits recorded during the entire 2025 navigation season. The confirmed traffic represented approximately 7.8 million tonnes DWT, while transit cargo is estimated at approximately 3.7 million tonnes.
Traffic was broadly balanced by direction, with 51 eastbound and 53 westbound voyages. The structure of traffic, however, differed significantly by direction. Eastbound tanker and bulk carrier voyages were predominantly cargo-carrying, while a substantial share of westbound bulk carrier traffic was related to fleet repositioning.
The 2026 season has also seen increased participation by large conventional commercial vessels, particularly tankers and bulk carriers, as well as a rise in international Asia-Europe transits. By September 30, four such voyages had been completed, compared with one during the entire 2025 season.
Navigation remained active at the end of September. In addition to the 104 confirmed transits, 25 vessels were already within the NSR and another 20 voyages were underway and expected to include an NSR transit. If the majority of these voyages complete their NSR passage, the season could approach 150 confirmed transits. Based on completed and ongoing voyages, we cautiously estimate that total transit cargo could exceed 4.5 million tonnes. Both the 150-transit and 4.5-million-tonne figures are scenario-based estimates and should not be treated as final season results.
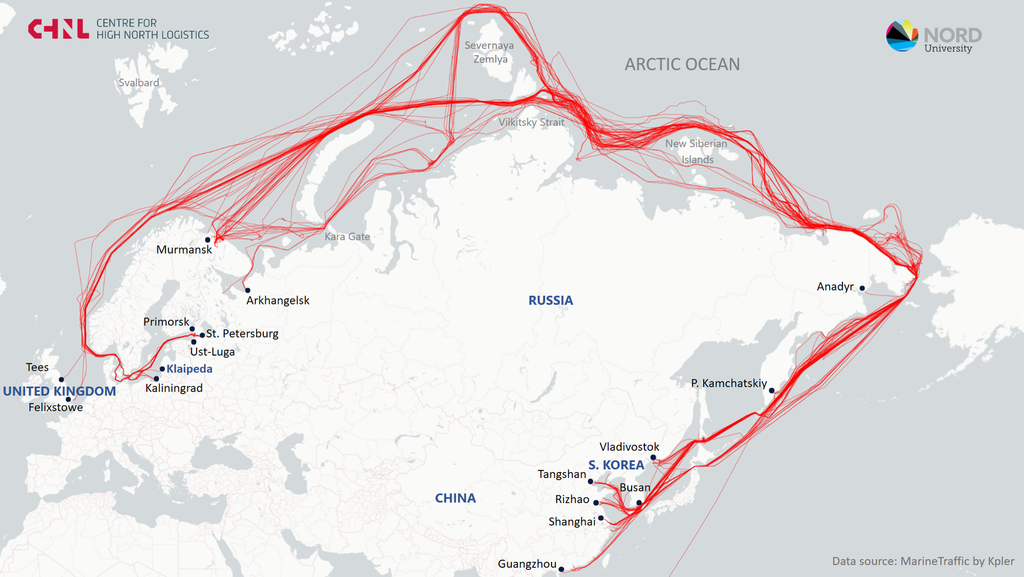
Figure 1. Map of all NSR Transit Voyages as of September 30, 2026. Source: MarineTraffic by Kpler; analysis and visualization by CHNL.
Scope and Methodology
This review presents our interim assessment of NSR transit shipping in 2026 as of September 30, focusing on the scale and structure of transit traffic, main vessel types and shipping patterns. The analysis is based primarily on AIS data from MarineTraffic by Kpler, supplemented by available information on individual vessels and voyages. As the navigation season is still ongoing, the results should be considered preliminary.
For the analysis, we divided all identified voyages into 4 categories based on their status as of September 30. The first category includes vessels that had completed the NSR transit and reached their final destination; the second, vessels that had completed the NSR passage but were still sailing towards their final destination; the third, vessels still within the NSR area; and the fourth, vessels that had started voyages expected to include an NSR transit.
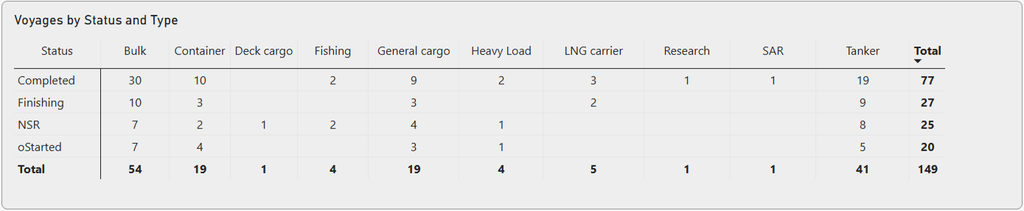
Table 1. Classification of NSR Transit Voyages by Status as of September 30, 2026
The first two categories consist of vessels that had already completed their NSR passage as of September 30 and therefore form the basis for the confirmed transit statistics in this review. Whether or not a vessel had subsequently reached its final destination does not affect its classification as a confirmed NSR transit. The remaining two categories are excluded from the confirmed results and are considered separately in the Potential Season Outcome section.
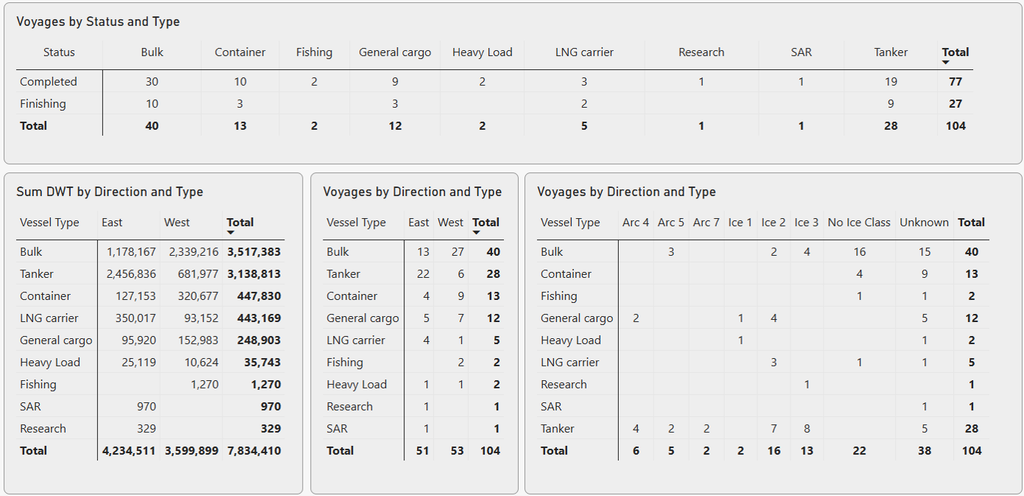
Table 2. Confirmed NSR Transit Voyages as of September 30, 2026
Cargo volumes represent our estimates, based on vessel type, deadweight, observed draught, known cargo flows and other available voyage information. They should therefore be treated as indicative estimates rather than official cargo statistics.
Ice Conditions
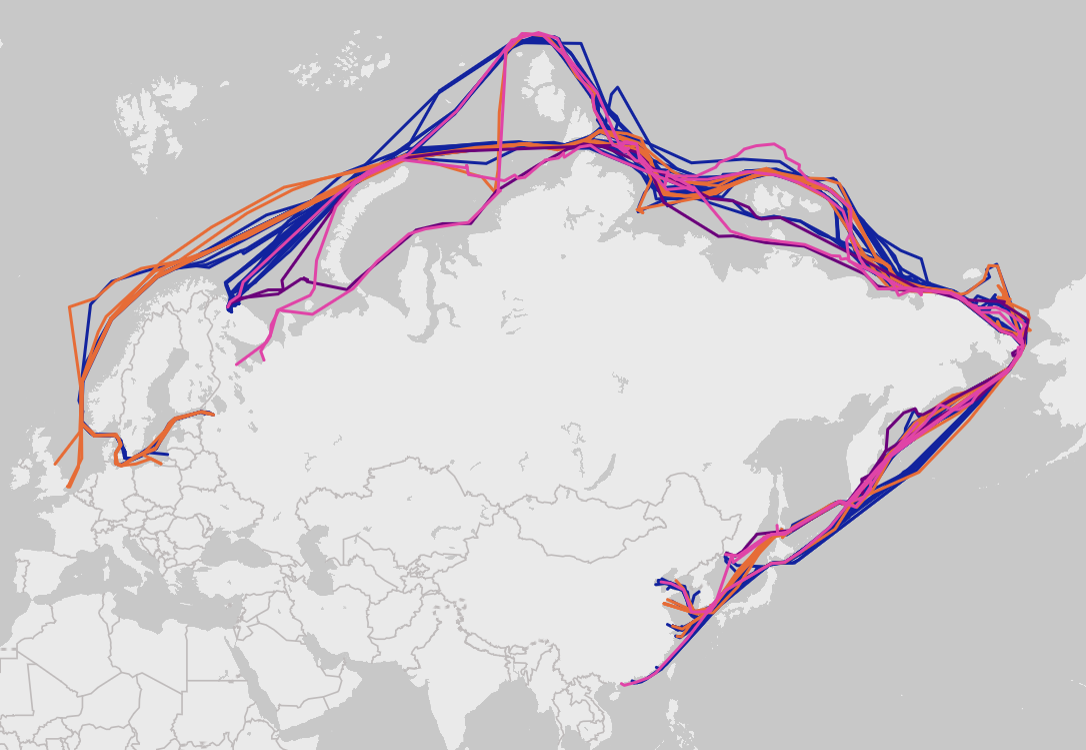
During the first half of August, a significant share of transit traffic used a high-latitude route north of the Severnaya Zemlya archipelago, bypassing it from the north instead of using the conventional route through the Vilkitsky Strait. By the final third of August, ice conditions had improved and traffic had begun shifting back towards the traditional NSR route through the Vilkitsky Strait. At the same time, ice concentrations decreased along the route, progressively expanding the areas of open water available for navigation. By early September, these areas had developed into an increasingly continuous open-water corridor along most of the main transit route.
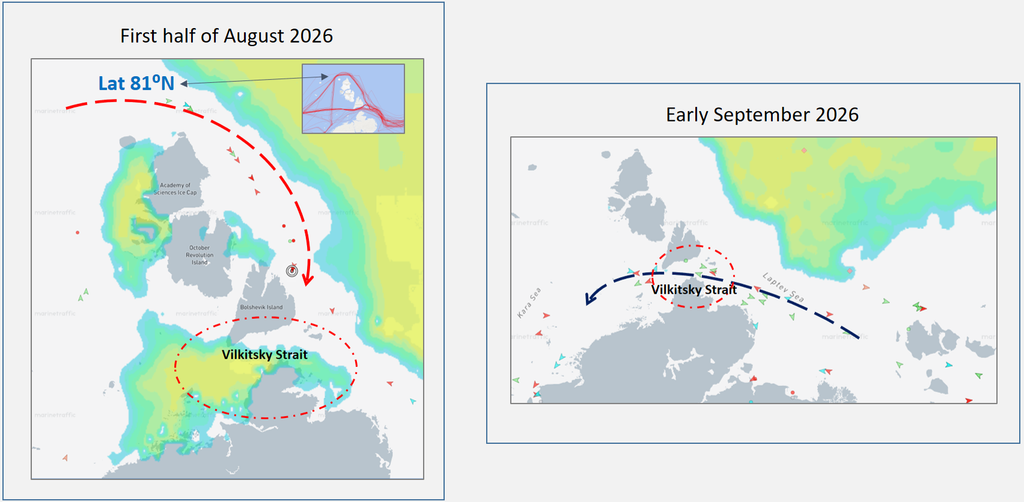
Figure 2. NSR Transit Routes and Ice Conditions during August and September 2026
Open-water conditions along most of the main transit route persisted beyond September 30, allowing active transit navigation to continue. Seasonal ice formation is expected to begin around mid-October, gradually limiting transit opportunities for vessels without ice class. For vessels with higher ice classes, navigation may continue into mid-November or even later, depending on ice conditions.
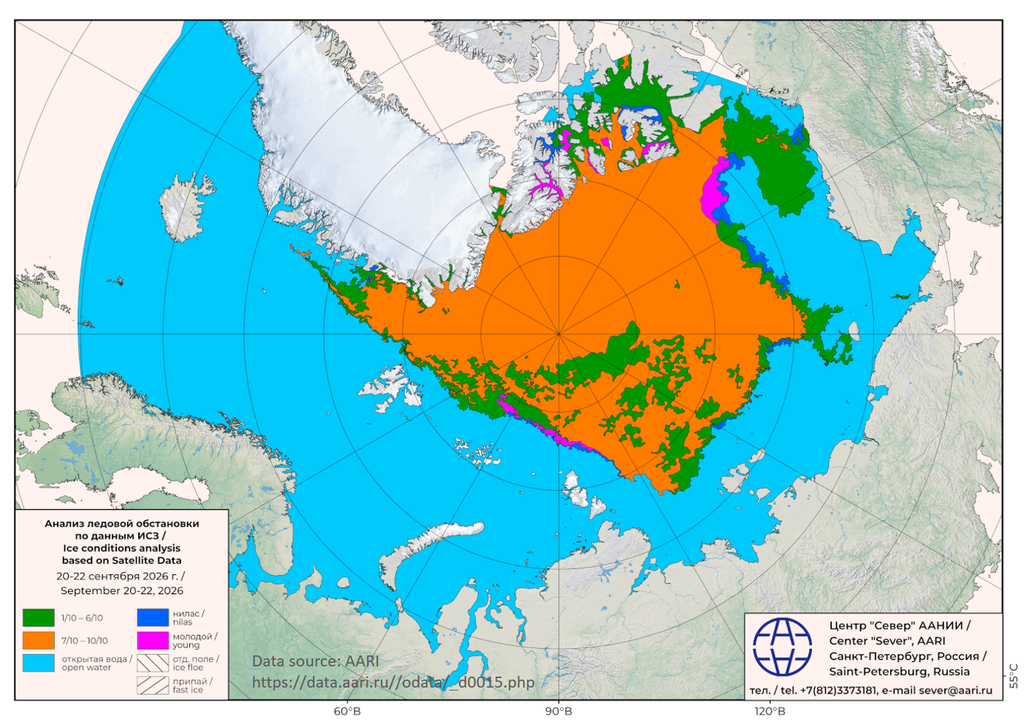
Figure 3. Ice Conditions along the NSR, September 20-22, 2026. Source: Arctic and Antarctic Research Institute (AARI).
Confirmed Transit Traffic as of September 30
As of September 30, we had identified 104 confirmed NSR transit voyages. Their combined deadweight amounted to approximately 7.8 million tonnes DWT, while we estimate the volume of cargo carried at around 3.7 million tonnes. Traffic was almost evenly divided by direction, with 51 eastbound and 53 westbound voyages.
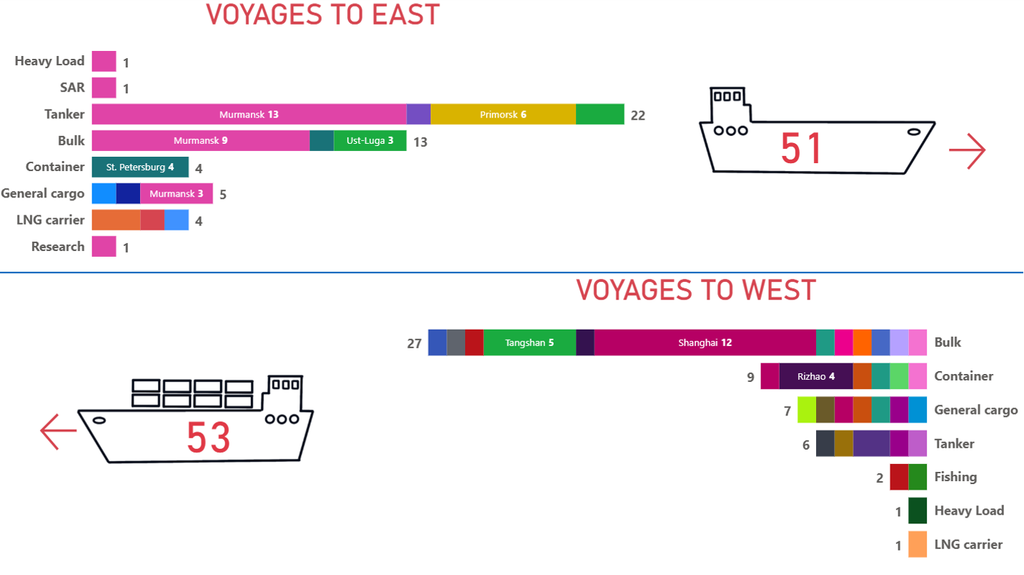
Figure 4. NSR Transit Voyages by Direction and Vessel Type as of September 30, 2026
Tankers
Tankers formed the largest cargo segment of NSR transit traffic. We identified 22 confirmed eastbound tanker voyages, carrying an estimated 2.1 million tonnes of cargo, primarily crude oil. Murmansk was the main port of departure, accounting for around 13 voyages. Another 5 voyages originated in Primorsk and 3 in Ust-Luga. The main destinations were in Asia, including Chinese ports and locations associated with further transshipment. In the opposite direction, we recorded 6 westbound tanker transits, with a combined deadweight of approximately 0.7 million tonnes DWT. Most appear to have been ballast voyages towards areas of subsequent loading in European Russia.
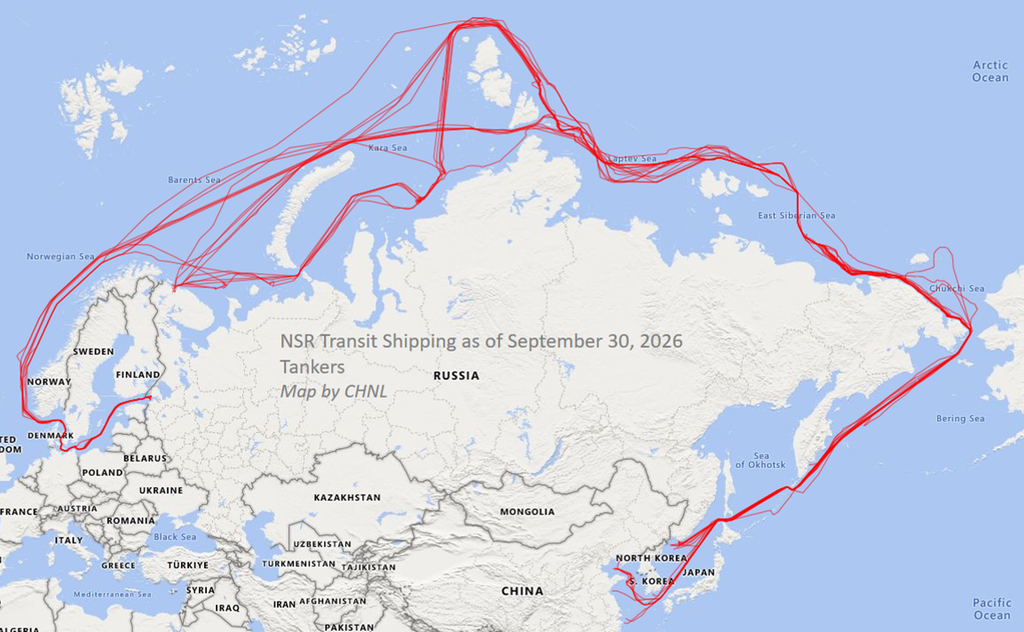
Figure 5. Tanker Transit Voyages on the NSR as of September 30 2026. Source: MarineTraffic by Kpler; analysis and visualization by CHNL.
Bulk Carriers
Bulk carriers were another prominent feature of the 2026 navigation season. We identified 13 eastbound bulk carrier transits, carrying an estimated 1.1 million tonnes of cargo. 8 voyages originated in the Murmansk area and 5 in Ust-Luga. Westbound bulk carrier activity was even more significant, with 27 voyages representing approximately 2.3 million tonnes DWT. A substantial share of these vessels had previously been operating in Asia and used the NSR to reposition towards the Baltic, Murmansk and other western destinations. For bulk carriers, the NSR therefore functions not only as a cargo corridor but also as a seasonal route for repositioning large conventional commercial tonnage.
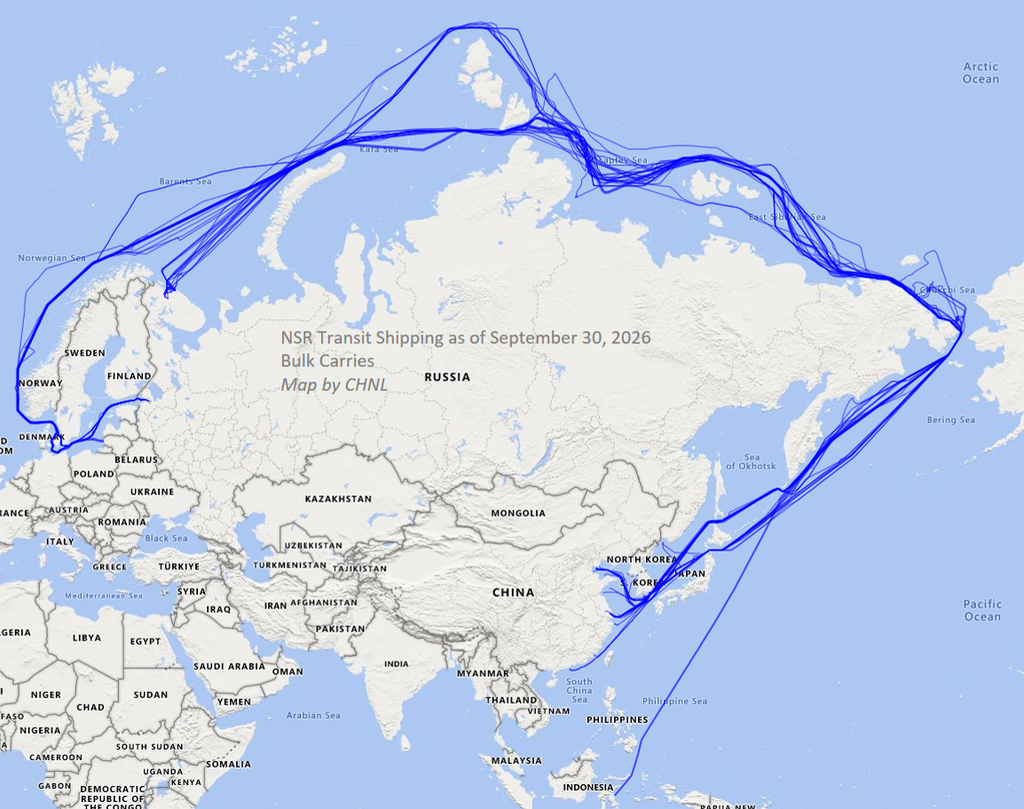
Figure 6. Bulk Carrier Transit Voyages on the NSR as of September 30 2026. Source: MarineTraffic by Kpler; analysis and visualization by CHNL.
Other Commercial Shipping
Container ships, general cargo vessels and LNG carriers also represented a visible share of confirmed transit activity. We recorded 13 container ship voyages, including 4 eastbound and 9 westbound, and 12 general cargo transits, including 5 eastbound and 7 westbound. Westbound voyages included routes from Asian ports towards the Baltic and other European destinations.
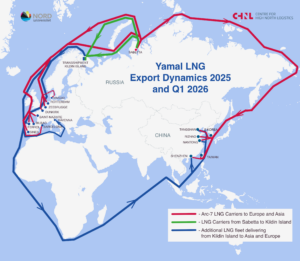
Cargo information for container ships and general cargo vessels remains very limited. Based on the information currently available, we estimate that these two categories together accounted for approximately 0.2 million tonnes of transit cargo, although the actual volume may have been higher. We also recorded 5 LNG carrier transits, including 4 eastbound and 1 westbound voyage. The eastbound voyages carried an estimated 0.3 million tonnes of LNG. The remaining confirmed traffic consisted of a small number of specialized vessels, including heavy-lift, research and auxiliary ships.
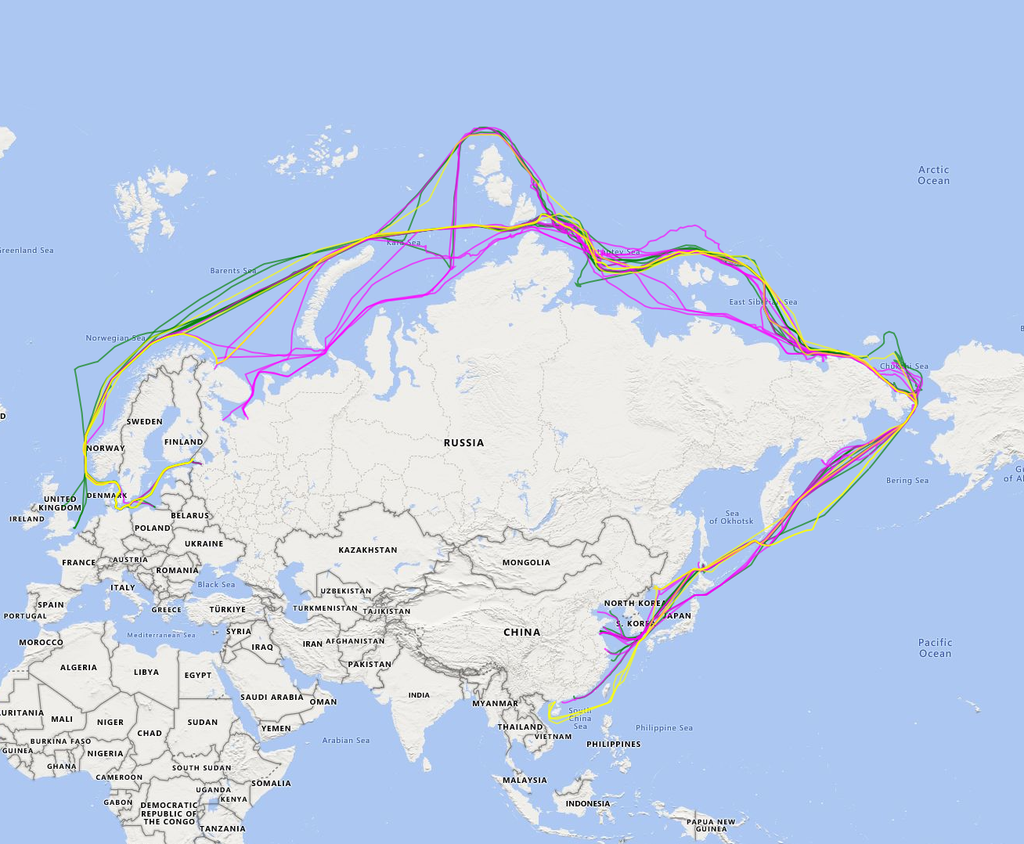
Figure 7. Other Commercial Shipping Transit Voyages on the NSR as of September 30 2026. Source: MarineTraffic by Kpler; analysis and visualization by CHNL.
International Asia-Europe Transit Voyages
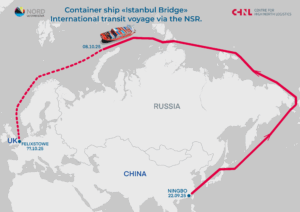
Another notable development in 2026 is the increase in voyages directly between Asian and European ports, with Russia being neither the origin nor the final destination. In 2025, we identified only 1 completed transit of this type, from China to Felixstowe in the UK.
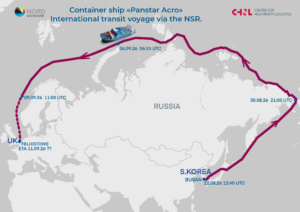
By September 30, 2026, 4 international Asia-Europe voyages had been completed. The container ship Panstar Acro sailed from Busan, South Korea, to Felixstowe, UK, in 20 days, and subsequently began a return voyage from Europe to Busan via the NSR. The container ship Dubai Tower sailed from Qingdao, China, to Tees, UK, in 21 days, while Riyadh Mukaab, also a container ship, sailed from Ningbo, China, to Felixstowe, UK, in 21 days. The bulk carrier Nan Xin 27 completed the voyage from Cangzhou, China, to Klaipeda, Lithuania, in 35 days. This remains a small segment of overall NSR traffic. Several voyages currently included in the potential traffic group could also become international Asia-Europe transits if they are completed on their currently indicated routes.
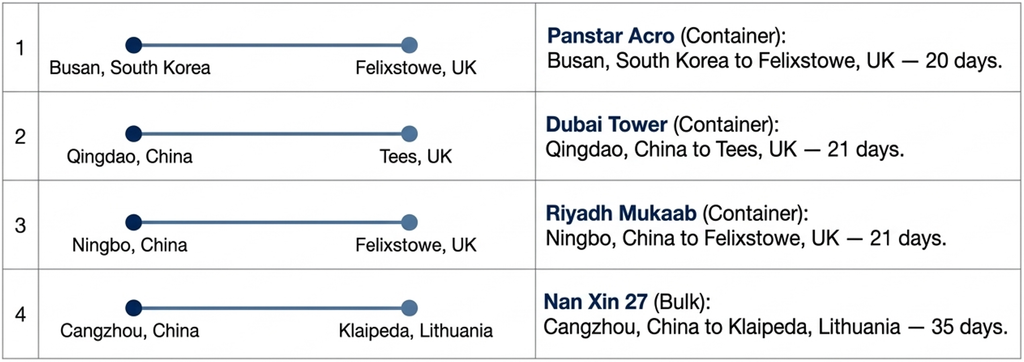
Figure 8. International Asia-Europe Transit Voyages via the NSR as of September 30 2026
Comparison with the 2025 Navigation Season
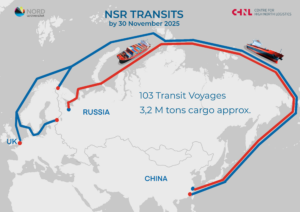
Compared with the full 2025 season, the 104 confirmed transits recorded by September 30, 2026 represented approximately 7.8 million tonnes DWT versus 6.2 million tonnes in 2025 (+26%), while estimated cargo increased from 3.2 to 3.7 million tonnes (+15%). Average deadweight per voyage increased from approximately 60,000 tonnes in 2025 to approximately 75,000 tonnes in 2026, indicating that the increase in transit activity was driven not only by a higher number of voyages but also by larger vessels.
Potential Season Outcome
As of September 30, in addition to the 104 confirmed transits, we were tracking 45 potential voyages: 25 vessels were already within the NSR (15 westbound and 10 eastbound), while another 20 voyages had already started. If the majority of the 45 currently tracked potential voyages complete their NSR passage, the 2026 season could approach 150 confirmed transits even without additional departures. Further voyages later in the season could push the final total above that level.
Based on completed and ongoing voyages, we cautiously estimate that total transit cargo could exceed 4.5 million tonnes. This figure, together with the 150-transit scenario, should be regarded as an interim estimate rather than a forecast of the final result. Official transit cargo figures are expected to be published by the Northern Sea Route Directorate after the end of the navigation season.
Our next publication on NSR transit shipping is planned for December 2026, after the main navigation season has concluded. It will provide more complete results for the 2026 season, including updated transit and cargo figures and a more detailed analysis of the main shipping trends.